Did you know that the average person spends about 6 months of their life waiting for red lights to turn green? In the fast-paced world of day trading, every second counts, and understanding timeframes can make all the difference. This article dives into the various timeframes used in day trading, how to select the best one for your strategy, and the significance of short-term versus long-term approaches. We'll explore the implications of using 1-minute, 5-minute, 15-minute, and hourly charts, and discuss the impact of news events and technical indicators on trading decisions. Additionally, we’ll highlight common mistakes traders make with timeframes and offer tips for beginners. By grasping these concepts, you can enhance your trading efficiency and risk management strategies. Let's get started with DayTradingBusiness!
What are the different timeframes used in day trading?
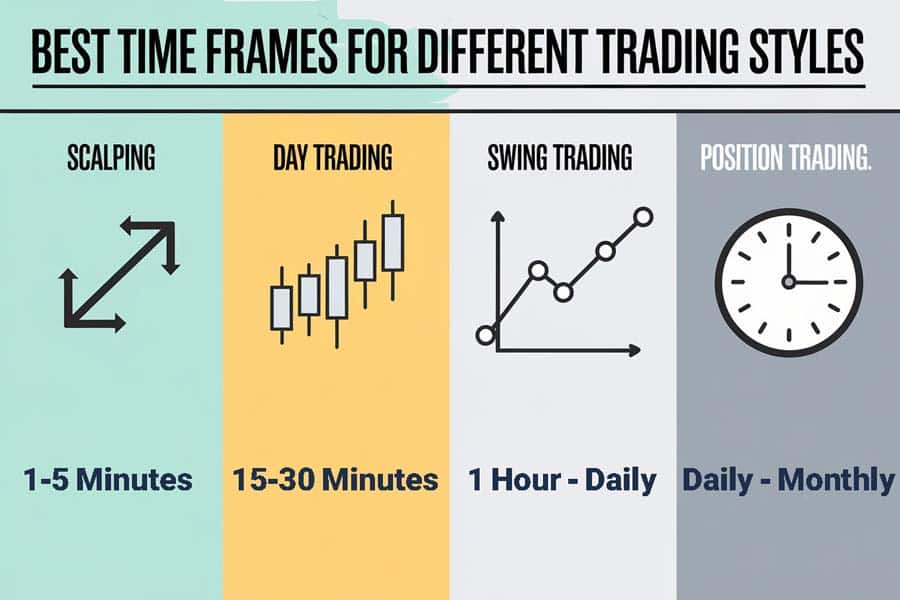
In day trading, common timeframes include:
1. 1-Minute Charts: For quick trades and scalping.
2. 5-Minute Charts: Popular for capturing short-term movements.
3. 15-Minute Charts: Balances detail and broader trends for more informed decisions.
4. 30-Minute Charts: Useful for identifying intraday trends.
5. Hourly Charts: Helps in spotting significant price movements throughout the day.
Each timeframe offers unique insights, allowing traders to tailor strategies to their preferences and market conditions.
How do I choose the best timeframe for day trading?
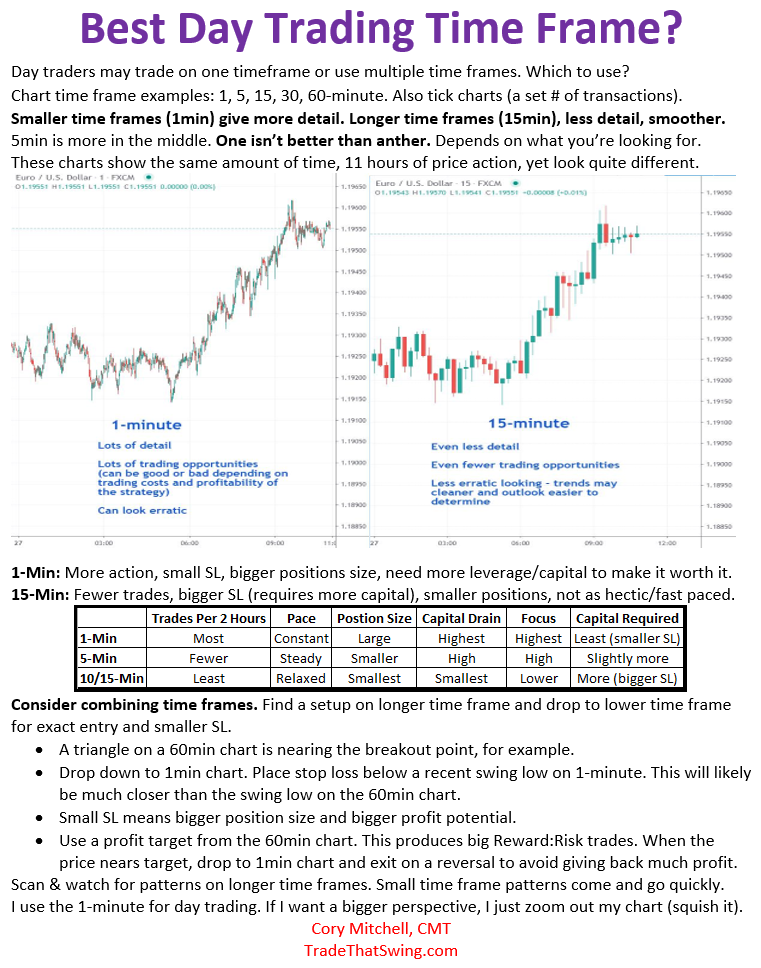
To choose the best timeframe for day trading, consider your trading style and objectives. If you prefer quick trades, use shorter timeframes like 1-minute or 5-minute charts. For a more relaxed approach, 15-minute or 30-minute charts can work well. Analyze your ability to monitor trades; shorter timeframes require constant attention, while longer ones allow for more flexibility. Test different timeframes with a demo account to find what aligns best with your strategy and risk tolerance.
What is the significance of short-term vs. long-term timeframes in day trading?
Short-term timeframes in day trading, like 1-minute or 5-minute charts, allow traders to capitalize on quick price movements and volatility, enabling rapid entry and exit for small profits. Long-term timeframes, such as hourly or daily charts, help identify broader trends and support resistance levels, providing context for trades.
Using short-term strategies focuses on immediate market reactions, while long-term approaches prioritize overall market conditions. Choosing the right timeframe is crucial; it impacts risk management, trade frequency, and profit potential. Balancing both can enhance a trader's strategy and adaptability in varying market conditions.
How do timeframes affect day trading strategies?
Timeframes impact day trading strategies by influencing trade frequency, risk management, and decision-making. Shorter timeframes, like 1-minute or 5-minute charts, allow for quick trades and rapid gains but require precise execution and can increase emotional stress. Longer timeframes, such as 15-minute or hourly charts, provide more context, reducing noise and helping identify trends, but may limit trade opportunities. Selecting the right timeframe aligns with your trading style, risk tolerance, and market conditions, ultimately shaping your strategy's effectiveness.
What are the pros and cons of using a 1-minute chart for day trading?
Pros of using a 1-minute chart for day trading:
1. Quick Signals: Allows for rapid identification of entry and exit points.
2. Increased Trades: Facilitates more trading opportunities within a short time.
3. Granular Analysis: Provides detailed price movements and market reactions.
Cons of using a 1-minute chart for day trading:
1. Noise: Higher volatility can lead to false signals and confusion.
2. Overtrading Risk: Increased frequency may result in impulsive decisions.
3. Shorter Timeframe Stress: Can be mentally exhausting and requires constant focus.
How does a 5-minute timeframe impact trading decisions?
A 5-minute timeframe allows traders to make quick decisions based on short-term price movements. It helps identify trends and reversals rapidly, facilitating faster entries and exits. Traders can take advantage of volatility, capturing small price changes for quick profits. However, it also increases the risk of noise and false signals, requiring strong risk management strategies. In essence, a 5-minute timeframe suits active traders who thrive on rapid decision-making and can handle the associated risks.
What role does a 15-minute chart play in day trading?

A 15-minute chart in day trading helps traders identify short-term trends and price movements. It provides a clearer view of intra-day fluctuations, allowing for timely entry and exit points. Traders use it for spotting patterns, support and resistance levels, and confirming signals from other indicators. This timeframe balances detail with broader market context, making it popular for quick trades without getting lost in noise.
How can I effectively use an hourly chart for day trading?
To effectively use an hourly chart for day trading, focus on the following steps:
1. Identify Trends: Look for clear trends on the hourly chart. Use trendlines to visualize upward or downward movements.
2. Set Entry and Exit Points: Determine your entry and exit points based on support and resistance levels visible on the hourly chart.
3. Use Indicators: Incorporate technical indicators like moving averages or RSI to confirm signals and enhance decision-making.
4. Monitor Volume: Pay attention to volume spikes; they often indicate potential reversals or breakouts.
5. Check Multiple Timeframes: Validate your hourly chart analysis with higher and lower timeframes for better context.
6. Plan Your Trades: Develop a trading plan, including risk management and position sizing, to avoid emotional decisions.
7. Stay Updated: Watch for news events that could impact price movements during the trading day.
Using these strategies will help you make informed decisions while trading on an hourly chart.
What are the key differences between day trading and swing trading timeframes?

Day trading involves holding positions for minutes to hours, closing all trades by the end of the day. Swing trading, on the other hand, typically involves holding positions for several days to weeks. Day traders aim to capitalize on short-term market movements, while swing traders look for larger price shifts over a longer period. Essentially, day trading focuses on quick, frequent trades, whereas swing trading is about capturing broader trends.
How do timeframes influence risk management in day trading?
Timeframes directly impact risk management in day trading by determining how quickly traders must react to market changes. Shorter timeframes, like 1-minute or 5-minute charts, increase volatility and require tighter stop-loss orders to protect against rapid price swings. In contrast, longer timeframes, such as 15-minute or hourly charts, allow for more room to manage trades but can expose traders to overnight risks if positions are held too long. Choosing the right timeframe helps align risk tolerance with potential rewards, making it crucial for effective day trading strategies.
What is the best timeframe for beginners in day trading?
For beginners in day trading, a timeframe of 1 to 5 minutes is often best. This allows for quick entries and exits, helping to capitalize on small price movements. Start with a 5-minute chart to identify trends and support/resistance levels, then use the 1-minute chart for precise entries. Focus on highly liquid stocks or ETFs to ensure you can execute trades smoothly. Practice consistently to develop your skills and confidence.
## What Are the Best Timeframes for Day Trading?
Day trading involves buying and selling financial instruments within the same trading day to profit from short-term price movements. Day traders typically use various timeframes, such as 1-minute, 5-minute, or 15-minute charts, to make quick decisions based on market trends and volatility.
Learn more about: What is Day Trading?
How do news events affect different day trading timeframes?

News events can significantly impact day trading timeframes by increasing volatility and influencing price movements. For short-term traders, such as scalpers, breaking news can create rapid price swings, offering quick profit opportunities. Meanwhile, swing traders might react to news over a few hours or days, adjusting positions based on how the market digests the information. Long-term day traders often use news to identify trends that could last several days, allowing them to capitalize on sustained moves. Overall, the immediacy and nature of the news dictate how each timeframe responds, with shorter timeframes reacting more quickly than longer ones.
Learn about How to Stay Updated on Crypto Market News for Day Trading
What are common mistakes traders make with timeframes?
Traders often make several common mistakes with timeframes in day trading. One major error is using too short a timeframe, leading to overtrading and poor decision-making. Another mistake is failing to align their trading strategy with the chosen timeframe, causing confusion and inconsistent results. Many traders neglect to consider market volatility, leading to misjudged entries and exits. Additionally, some traders ignore the importance of setting realistic goals based on their timeframe, resulting in frustration and burnout. Lastly, not adapting to changing market conditions can hinder a trader's effectiveness.
How can I analyze trends across multiple timeframes in day trading?
To analyze trends across multiple timeframes in day trading, start by selecting your primary timeframe, like 5 minutes for entry and exit signals. Use a higher timeframe, such as 15 or 30 minutes, to identify the overall trend direction. Look for alignment: if both timeframes show the same trend, it strengthens your trade decision.
Incorporate technical indicators, like moving averages or RSI, to spot potential reversals or continuations. Use candlestick patterns for additional context on price movements. Regularly compare the shorter timeframe against the higher one to spot divergences or confirmations.
Lastly, keep a trading journal to note how trends across different timeframes impact your trades. This will refine your strategy over time.
Learn about How to Analyze Crypto Market Trends for Day Trading
What tools can help me manage different day trading timeframes?
To manage different day trading timeframes, consider these tools:
1. Charting Software: Platforms like TradingView or MetaTrader help you analyze multiple timeframes with customizable charts.
2. Technical Indicators: Use indicators like Moving Averages or RSI to gauge market trends across various timeframes.
3. Trade Journals: Tools like Edgewonk or Tradervue help track your trades and performance, allowing you to adjust strategies based on timeframe effectiveness.
4. News Aggregators: Services like Benzinga or MarketWatch keep you updated on market news that can impact different timeframes.
5. Alerts and Notifications: Set up alerts through your trading platform to notify you of price movements or trends across chosen timeframes.
Using these tools can enhance your ability to navigate and optimize your day trading strategies.
How do timeframes interact with technical indicators in day trading?
Timeframes in day trading interact with technical indicators by influencing the signals and trends traders observe. Shorter timeframes, like 1-minute or 5-minute charts, provide quick, responsive signals but can be noisy, leading to false signals. In contrast, longer timeframes, such as 30-minute or hourly charts, smooth out volatility, offering clearer trends but slower signals.
Day traders often use multiple timeframes to confirm indicators; for example, they might check a 15-minute chart for entry points while monitoring a 1-hour chart for overall trend direction. This multi-timeframe analysis helps enhance decision-making and improve accuracy in trades.
Conclusion about Understanding Day Trading Timeframes
Choosing the right timeframe is crucial for successful day trading, as it directly impacts your strategy, risk management, and overall trading performance. Whether you're utilizing 1-minute, 5-minute, or hourly charts, understanding the nuances of each can enhance your decision-making process. By aligning your timeframe with your trading goals and style, you can better navigate market fluctuations and optimize your trades. For comprehensive insights and support on mastering day trading timeframes, consider leveraging the expertise available at DayTradingBusiness.
Sources:
- Intraday time and order execution quality dimensions - ScienceDirect
- A Profitable Day Trading Strategy For The U.S. Equity Market by ...
- Monday mornings: Individual investor trading on days of the week ...
- A Profitable Day Trading Strategy For The US Equity Market
- Artificial intelligence techniques in financial trading: A systematic ...