Did you know that some traders believe that staring at charts for too long can lead to "chartitis"? While that may be a stretch, mastering Forex charts is essential for day traders. In this article, we’ll explore the best types of charts for Forex day trading, including the intricacies of candlestick charts and essential indicators. You'll learn how to read charts effectively, identify trends, and leverage support and resistance. We’ll also dive into ideal time frames, the advantages of live charts, and customization tips for enhanced analysis. Plus, we'll highlight common pitfalls to avoid and the role of moving averages and volume in charting. Equip yourself with the knowledge to combine chart analysis with other trading strategies, and elevate your Forex day trading game with insights from DayTradingBusiness.
What are the best types of charts for Forex day trading?
The best types of charts for Forex day trading are:
1. Candlestick Charts: They show price action and trends clearly, highlighting opening, closing, high, and low prices.
2. Line Charts: Simple and effective for visualizing price movements over time, making it easy to identify trends.
3. Bar Charts: Similar to candlesticks but focus more on price ranges, useful for seeing volatility.
4. Renko Charts: Filter out market noise and focus on price movement, helping traders identify trends without distractions.
5. Heikin-Ashi Charts: Offer a smoother view of price action, making it easier to spot trends and reversals.
Choose the chart type that aligns with your trading strategy and preferences.
How do candlestick charts work in Forex trading?
Candlestick charts in Forex trading display price movements over a specific time period. Each candlestick represents four key prices: open, high, low, and close. The body of the candle shows the range between the open and close prices, while the wicks indicate the high and low prices during that period.
Traders use patterns formed by these candlesticks to predict future price movements. For example, a bullish engulfing pattern suggests a potential price increase, while a bearish engulfing pattern indicates a possible decline. By analyzing these patterns alongside other indicators, traders can make informed decisions about buying or selling currencies.
What indicators should I use with Forex charts?
Use moving averages to identify trends. The Relative Strength Index (RSI) helps spot overbought or oversold conditions. Bollinger Bands indicate volatility and potential price reversals. MACD shows momentum and can signal buy or sell opportunities. Fibonacci retracement levels help find support and resistance zones. Volume indicators can confirm price movements. Combine these for a comprehensive analysis in Forex day trading.
How can I read Forex charts effectively?
To read Forex charts effectively, start by selecting the right chart type, like candlestick or line charts, for your trading style. Focus on key elements: price action, support and resistance levels, and trend lines. Use indicators like moving averages and RSI to identify trends and potential reversal points. Pay attention to timeframes; shorter ones are better for day trading. Practice analyzing patterns, like head and shoulders or flags, to predict future movements. Regularly review your trades to learn from successes and mistakes.
What time frames are ideal for Forex day trading charts?
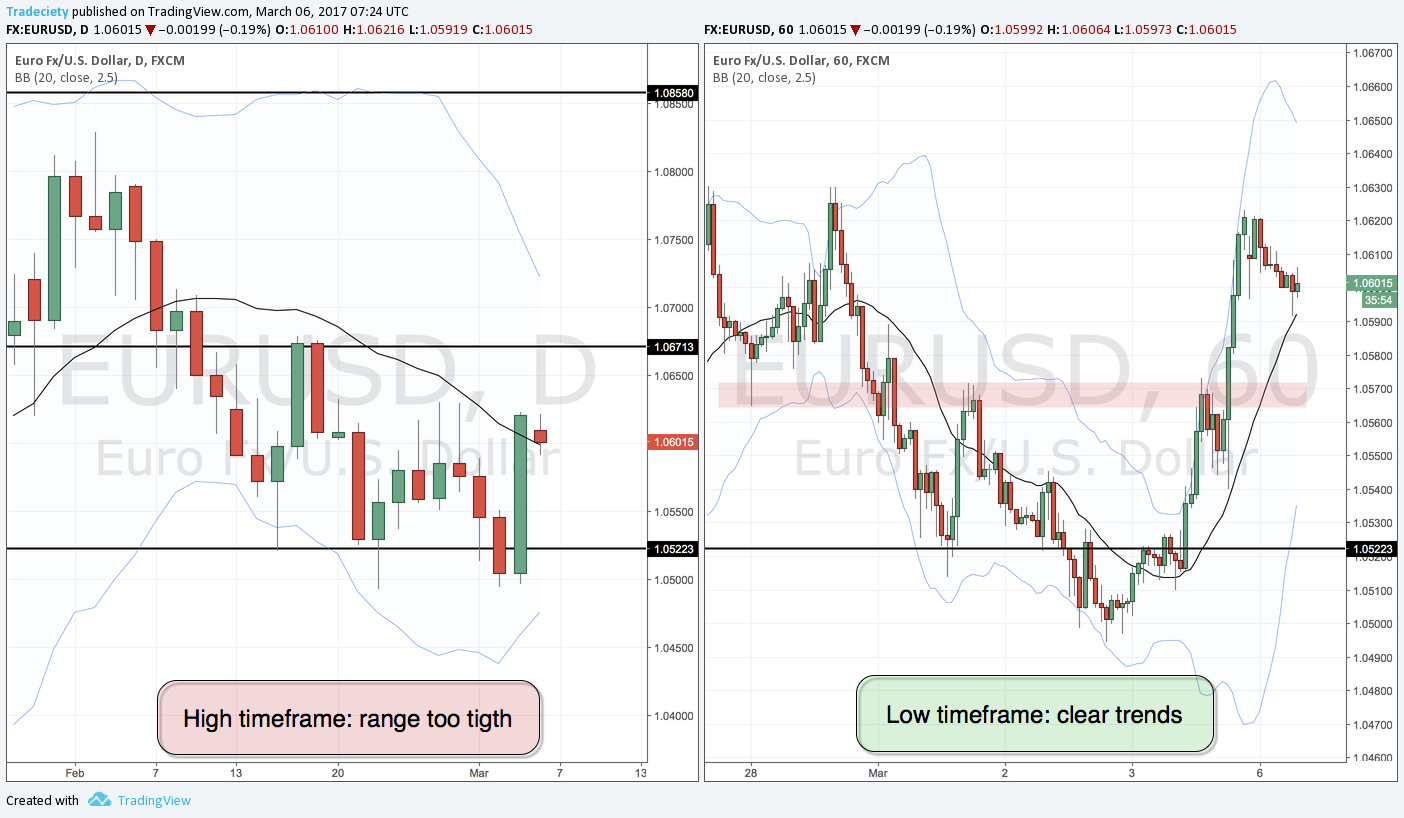
The ideal time frames for Forex day trading charts are typically 1-minute, 5-minute, and 15-minute charts. These shorter time frames allow traders to capture quick price movements and make fast decisions. Many traders also use 30-minute and hourly charts for broader context before entering positions.
How do I identify trends using Forex charts?
To identify trends using Forex charts, start by selecting a time frame that suits your trading style. Look for higher highs and higher lows to confirm an uptrend, or lower highs and lower lows for a downtrend. Use trend lines to visually connect these points. Moving averages can also help smooth out price action and show the overall direction. Additionally, pay attention to candlestick patterns and chart formations like flags or triangles. Regularly review support and resistance levels to understand where price may reverse or continue.
What is the role of support and resistance in Forex charts?

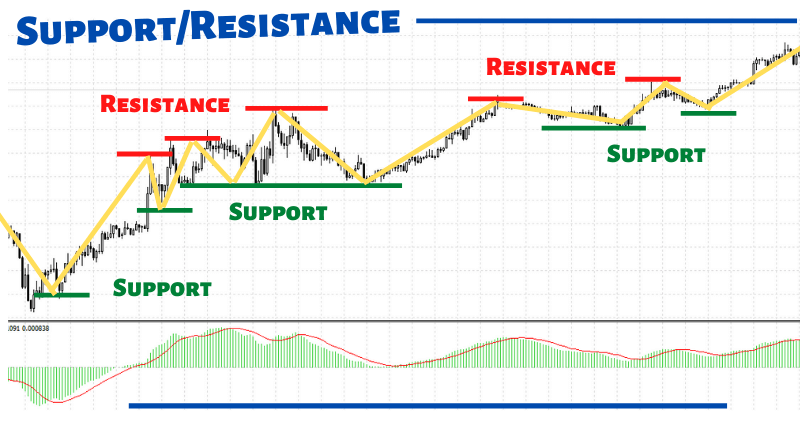
Support and resistance in Forex charts help traders identify potential price levels where the market may reverse or consolidate. Support is the price level where a downtrend can pause due to buying interest, while resistance is where an uptrend can stall due to selling pressure. Traders use these levels to make decisions about entry and exit points. For instance, buying near support and selling near resistance can enhance profitability. Recognizing these levels helps in setting stop-loss orders and managing risk effectively during Forex day trading.
How Can I Use Charts Effectively for Forex Day Trading?
To use charts for Forex day trading, follow these steps:
1. **Select Chart Type**: Use candlestick or bar charts for detailed price movement.
2. **Timeframe**: Choose shorter timeframes (1-minute, 5-minute) for day trading.
3. **Identify Trends**: Look for upward or downward trends using trendlines.
4. **Support and Resistance**: Mark key support and resistance levels to inform entry and exit points.
5. **Indicators**: Utilize indicators like Moving Averages and RSI to confirm signals.
6. **Volume Analysis**: Monitor volume to validate price movements.
7. **Practice**: Use demo accounts to practice reading charts before trading live.
This approach will help you effectively analyze Forex markets for day trading.
Learn more about: Understanding Forex Day Trading Markets
How do I use chart patterns for Forex trading decisions?
To use chart patterns for Forex trading decisions, first identify key patterns like head and shoulders, triangles, or flags on your charts. Look for breakout points where price moves beyond key support or resistance levels. Use these patterns to predict potential reversals or continuations in price trends. Confirm signals with volume and other indicators, such as RSI or MACD, to strengthen your decision. Set entry and exit points based on pattern measurements and always implement risk management strategies, like stop-loss orders, to protect your capital.
What are the advantages of using live Forex charts?
Live Forex charts offer several advantages for day trading. They provide real-time data, enabling traders to make quick decisions based on current market conditions. The visual representation of price movements helps in identifying trends and patterns, which can enhance technical analysis.
Additionally, live charts allow for immediate updates on price fluctuations, ensuring that traders react promptly to market changes. They often include various technical indicators and tools, making it easier to analyze potential entry and exit points.
Using live Forex charts also fosters better risk management, as traders can set stop-loss orders based on the most recent price levels. Overall, they are essential for informed trading and maximizing potential profits.
How can I customize my Forex charts for better analysis?

To customize your Forex charts for better analysis, follow these steps:
1. Choose the Right Timeframe: Select a timeframe that aligns with your trading strategy, whether it’s 1-minute, 5-minute, or daily charts.
2. Add Technical Indicators: Incorporate indicators like Moving Averages, RSI, or MACD to identify trends and momentum.
3. Use Custom Colors and Styles: Adjust colors for candlesticks and background to enhance visibility and reduce eye strain.
4. Draw Trend Lines: Manually add trend lines to identify support and resistance levels.
5. Set Up Alerts: Use alerts for price levels or indicator signals to stay informed without constant monitoring.
6. Use Multiple Chart Types: Experiment with line, bar, and candlestick charts to find what works best for your analysis.
7. Save Layouts: Once you find a setup that works, save your chart layout for quick access in future sessions.
By customizing these elements, you can enhance your Forex chart analysis and improve your trading decisions.
What common mistakes should I avoid when using Forex charts?
Avoid these common mistakes when using Forex charts for day trading:
1. Ignoring Time Frames: Don’t stick to a single time frame; analyze multiple ones for a clearer market picture.
2. Overcomplicating Analysis: Keep your charts simple. Too many indicators can create confusion and lead to poor decisions.
3. Neglecting Trend Analysis: Always identify the prevailing trend before making trades; trading against the trend increases risk.
4. Failing to Use Stop Losses: Always set stop losses to manage risk; not doing so can lead to significant losses.
5. Overtrading: Avoid trading too frequently based on short-term fluctuations; focus on high-probability setups.
6. Disregarding News Events: Major economic news can impact Forex charts dramatically. Stay informed to avoid unexpected volatility.
7. Not Practicing Risk Management: Ensure you manage your capital wisely; risking too much on a single trade can be detrimental.
Staying aware of these pitfalls can enhance your Forex trading success.
How do moving averages enhance Forex chart analysis?
Moving averages enhance Forex chart analysis by smoothing price data to identify trends and reversals. They help traders spot entry and exit points by highlighting support and resistance levels. Short-term moving averages react quickly to price changes, ideal for day trading. Long-term moving averages provide a clearer view of the overall trend. By observing crossovers between different moving averages, traders can make informed decisions on market direction. This clarity allows for better risk management and improved trading strategies.
What is the importance of volume in Forex charting?

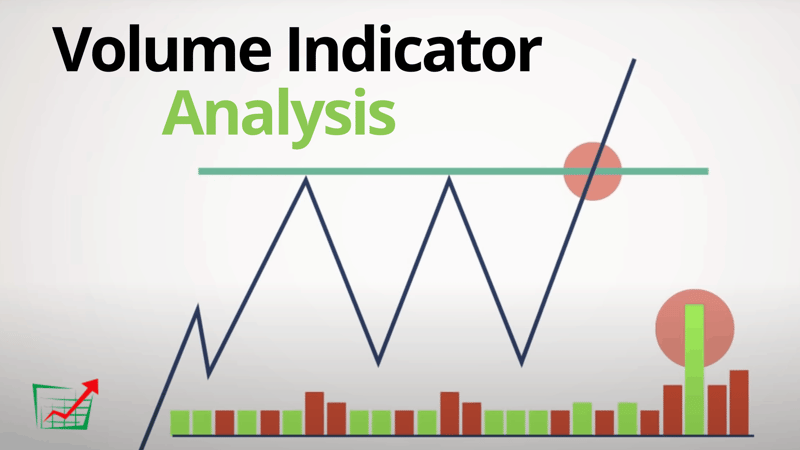
Volume in Forex charting is crucial because it indicates the strength of a price movement. High volume confirms trends, suggesting that the movement is supported by significant interest, while low volume can signal weakness or potential reversals. Additionally, volume helps traders identify entry and exit points, assess liquidity, and gauge market sentiment. Monitoring volume alongside price action provides a clearer picture of market dynamics, enhancing decision-making in Forex day trading.
How do I analyze Forex charts for short-term strategies?
To analyze Forex charts for short-term strategies, focus on these key steps:
1. Choose the Right Chart Type: Use candlestick charts for clear price action insights. They show open, close, high, and low prices.
2. Set Time Frames: For day trading, use shorter time frames like 1-minute, 5-minute, or 15-minute charts to capture quick price movements.
3. Identify Trends: Look for uptrends, downtrends, or consolidations. Draw trendlines to visualize the direction of the market.
4. Use Indicators: Apply technical indicators like Moving Averages (MA) to spot trends, and Relative Strength Index (RSI) to gauge overbought or oversold conditions.
5. Support and Resistance Levels: Mark key support and resistance levels on your charts. These can indicate potential entry and exit points.
6. Volume Analysis: Check volume spikes alongside price movements to confirm trends. High volume adds validity to price action.
7. Candlestick Patterns: Look for reversal or continuation patterns like pin bars or engulfing candles to make informed trades.
8. Risk Management: Always set stop-loss orders to manage risk effectively, ensuring you protect your capital.
By applying these steps consistently, you can effectively analyze Forex charts for short-term trading strategies.
What software tools can I use for Forex charting?
For Forex charting, consider using these software tools:
1. MetaTrader 4/5: Popular for its user-friendly interface and extensive features, including various indicators and chart types.
2. TradingView: Offers advanced charting tools, social networking features, and a wide range of indicators.
3. ThinkorSwim: Provides robust charting capabilities and real-time data, ideal for serious traders.
4. NinjaTrader: Great for advanced charting and automation, suitable for professional traders.
5. cTrader: Offers a clean interface with advanced charting tools and algorithmic trading options.
Choose based on your trading style and preferred features.
How can I combine chart analysis with other Forex trading strategies?
To combine chart analysis with other Forex trading strategies, start by identifying key support and resistance levels on your charts. Use technical indicators like moving averages or RSI to confirm entry and exit points. Integrate fundamental analysis by considering economic news that may impact currency pairs.
For example, if your chart analysis indicates a bullish trend, check for upcoming economic reports that could support that trend. Additionally, implement risk management techniques, such as setting stop-loss orders based on chart patterns. This way, you leverage visual data while aligning with broader market trends and news events.
Conclusion about How to Use Charts for Forex Day Trading
In conclusion, effectively utilizing charts is essential for successful Forex day trading. By understanding various chart types, mastering candlestick patterns, and applying key indicators, traders can make informed decisions. It's crucial to identify trends, recognize support and resistance levels, and avoid common pitfalls. Customizing charts and integrating them with other strategies enhances analysis and trading outcomes. For deeper insights and tailored support, turn to DayTradingBusiness to elevate your trading game.
Learn about How to Use Charts in Day Trading