Did you know that the stock market has more ups and downs than a roller coaster? Understanding the twists and turns of day trading can be exhilarating, especially when leveraging technical indicators. This article dives into the most popular tools used by traders, such as moving averages, RSI, and Bollinger Bands, to refine their strategies. We’ll explore how volume indicators and chart patterns can influence trading decisions, the importance of backtesting, and the psychological aspects of trading. Discover best practices for combining indicators and adapting to market volatility. Whether you're identifying trends or avoiding common pitfalls, this guide from DayTradingBusiness offers essential insights for successful day trading.
What are the most popular technical indicators for day trading stocks?
The most popular technical indicators for day trading stocks are:
1. Moving Averages (MA): Often used to identify trends, with common periods being 50-day and 200-day averages.
2. Relative Strength Index (RSI): Measures momentum by comparing recent gains to recent losses, helping traders spot overbought or oversold conditions.
3. Moving Average Convergence Divergence (MACD): Shows the relationship between two moving averages, indicating potential buy or sell signals.
4. Bollinger Bands: Consist of a middle band (SMA) and two outer bands that indicate volatility and potential price reversals.
5. Volume: Analyzing trading volume can confirm trends and signal potential reversals when combined with price action.
6. Stochastic Oscillator: Compares a security's closing price to its price range over a specific period, indicating overbought or oversold conditions.
These indicators help day traders make informed decisions and enhance their trading strategies.
How do moving averages help in day trading strategies?
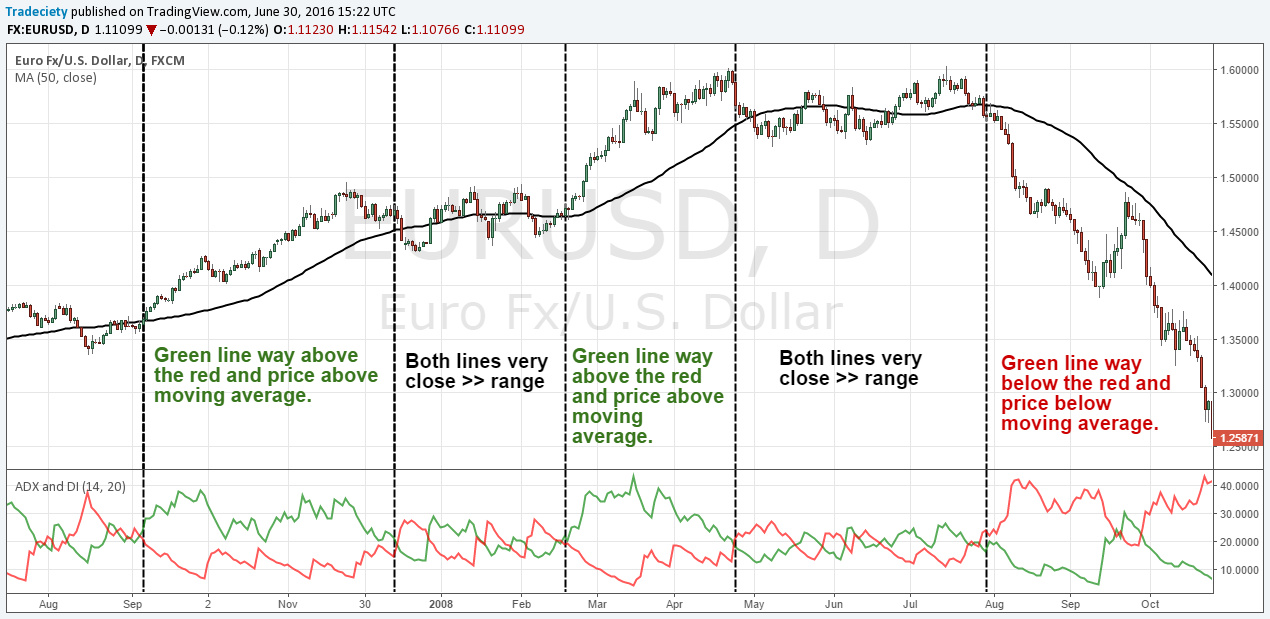
Moving averages help in day trading by smoothing out price data to identify trends and potential entry or exit points. Traders use short-term moving averages, like the 5-day or 10-day, to spot quick shifts in momentum. When a short-term moving average crosses above a longer-term one, it often signals a buy opportunity. Conversely, a cross below can indicate a sell signal. This helps traders make quick decisions based on market conditions, enhancing their strategy's effectiveness.
What is the significance of the Relative Strength Index (RSI) in day trading?
The Relative Strength Index (RSI) is significant in day trading because it helps traders identify overbought or oversold conditions in a stock. An RSI above 70 suggests that a stock may be overbought, indicating a potential price correction. Conversely, an RSI below 30 signals that a stock may be oversold, hinting at a possible price increase. Traders use these signals to make informed buy or sell decisions, enhancing their entry and exit strategies. Additionally, RSI divergence can indicate potential trend reversals, further guiding trading actions.
How can traders use Bollinger Bands effectively?
Traders can use Bollinger Bands effectively by following these strategies:
1. Identify Volatility: Use the bands to gauge market volatility. When bands widen, volatility increases; when they contract, it decreases.
2. Entry and Exit Points: Buy when the price touches the lower band and sell when it touches the upper band, especially in a trending market.
3. Trend Confirmation: Look for price action near the middle band (the moving average) to confirm trends. If the price is above it, consider bullish positions; if below, bearish.
4. Breakouts: Watch for price breaking out of the bands. A breakout above the upper band can signal a strong upward move, while a drop below the lower band can indicate a downward trend.
5. Combine with Other Indicators: Use other indicators like RSI or MACD for confirmation, enhancing the reliability of signals generated by Bollinger Bands.
Applying these methods can help traders make informed decisions and manage risks effectively in day trading stocks.
What role do candlestick patterns play in day trading?

Candlestick patterns are crucial in day trading as they help traders identify potential price movements and market sentiment. Patterns like doji, engulfing, or hammer indicate reversals or continuations, guiding entry and exit points. Traders use these signals to make quick decisions, enhancing their chances of profit. Understanding candlestick patterns allows for better risk management and timing in volatile markets.
How do volume indicators impact day trading decisions?
Volume indicators significantly influence day trading decisions by providing insights into market activity and potential price movements. High volume often signals strong interest in a stock, suggesting that a price trend may continue, while low volume can indicate weakness and potential reversals. Traders use volume trends to confirm breakouts or identify potential false signals. For example, a price increase accompanied by rising volume suggests strong buying interest, reinforcing the decision to enter a trade. Conversely, if a stock's price rises but volume decreases, it may be a warning sign to reconsider the position. Understanding these dynamics helps traders make informed, timely decisions in fast-paced environments.
What is the difference between leading and lagging indicators for day trading?
Leading indicators predict future price movements, helping traders anticipate trends before they occur. Examples include RSI (Relative Strength Index) and MACD (Moving Average Convergence Divergence).
Lagging indicators, on the other hand, confirm trends based on past price action. Common examples are moving averages and Bollinger Bands.
In day trading, leading indicators can signal entry points, while lagging indicators help confirm exit points.
What Are the Best Stocks for Day Trading Today Using Technical Indicators?
The best stocks for day trading today include high-volume, volatile stocks like Tesla (TSLA), Apple (AAPL), and Amazon (AMZN). Leverage technical indicators such as moving averages, RSI, and MACD to identify entry and exit points effectively.
Learn more about: Best Stocks for Day Trading Today
How can Fibonacci retracement levels assist day traders?
Fibonacci retracement levels help day traders identify potential support and resistance zones. By plotting these levels on a stock chart, traders can spot where price corrections might occur after a trend. For example, if a stock rallies and then pulls back to the 38.2% level, traders often watch for a reversal to enter long positions. Similarly, if prices approach the 61.8% level during a downtrend, it could signal a bounce back up. Using these retracement levels, day traders can make more informed decisions on entry and exit points, enhancing their trading strategies.
What are the best practices for combining technical indicators?
To effectively combine technical indicators for day trading stocks, use these best practices:
1. Diversity of Indicators: Mix trend indicators (like moving averages) with momentum indicators (like RSI) to gain a comprehensive view of market conditions.
2. Avoid Redundancy: Don’t use indicators that provide the same information. For instance, using both MACD and a simple moving average crossover might be excessive.
3. Confirm Signals: Use multiple indicators to confirm trade signals. For example, if a stock shows a bullish crossover and the RSI is above 50, it strengthens the buy signal.
4. Timeframe Alignment: Ensure indicators are set to the same timeframe. Day trading typically requires shorter timeframes, so adjust indicators accordingly.
5. Backtest Combinations: Before applying indicators in live trading, backtest combinations on historical data to evaluate effectiveness.
6. Adjust to Market Conditions: Be flexible. Different market conditions may require adjusting your indicator settings or the indicators you use.
7. Keep It Simple: Limit your indicators to three or four to avoid clutter, ensuring clarity in decision-making.
8. Use Volume Indicators: Incorporate volume-based indicators (like On-Balance Volume) to confirm price movements and enhance reliability.
Following these practices will help you leverage technical indicators effectively for day trading stocks.
How do traders identify trends using technical indicators?

Traders identify trends using technical indicators by analyzing price movements and chart patterns. Common indicators include moving averages, which smooth out price data to show the direction of the trend, and the Relative Strength Index (RSI), which indicates overbought or oversold conditions.
Traders often look for crossover signals—like when a short-term moving average crosses above a long-term moving average—as a sign of a bullish trend. Conversely, a crossover in the opposite direction signals a bearish trend.
Additionally, trendlines help visualize the direction of price movement. By connecting higher lows in an uptrend or lower highs in a downtrend, traders can confirm the trend's strength.
Volume indicators also play a role; increasing volume alongside price movement strengthens the trend's validity. Overall, combining these technical indicators provides a clearer picture of market trends for day trading stocks.
What are common mistakes to avoid when using technical indicators?
1. Overtrading: Relying too heavily on indicators can lead to excessive trades, increasing transaction costs and reducing profits.
2. Ignoring Market Context: Using indicators without considering broader market trends or news can result in misleading signals.
3. Overcomplicating Strategies: Mixing too many indicators can create confusion. Stick to a few that complement each other.
4. Neglecting Risk Management: Focusing solely on indicators while ignoring stop-loss orders or position sizing increases risk.
5. Following Indicators Blindly: Always validate signals with additional analysis or confirmation from price action.
6. Failing to Adapt: Markets change; what worked in one environment may not work in another. Regularly reassess your strategies.
7. Misinterpreting Signals: Understanding the nuances of each indicator is crucial. Misinterpretation can lead to poor decisions.
Avoiding these mistakes can enhance your day trading effectiveness with technical indicators.
How can day traders use chart patterns alongside technical indicators?
Day traders can use chart patterns like flags, triangles, and head-and-shoulders to identify potential price movements. Pair these patterns with technical indicators such as moving averages, RSI, or MACD for confirmation. For example, if a bullish flag pattern forms and the RSI is below 30, it suggests a potential upward breakout. Conversely, if a head-and-shoulders pattern appears alongside a bearish MACD crossover, it signals a probable price drop. This combination enhances decision-making, allowing traders to enter and exit positions with greater confidence.
Learn about How to Use Technical Analysis for Options Day Trading
What is the importance of backtesting technical indicators for day trading?

Backtesting technical indicators is crucial for day trading because it helps traders evaluate the effectiveness of their strategies using historical data. By testing indicators like moving averages or RSI against past market conditions, traders can identify patterns and optimize their entry and exit points. This process minimizes risk by revealing potential flaws in a strategy before real money is on the line. Additionally, backtesting builds confidence in a trading approach, allowing for more informed decision-making during live trades.
How do psychological levels affect technical analysis in trading?
Psychological levels influence technical analysis in trading by acting as key support and resistance points. Traders often place buy or sell orders around these levels, which can lead to increased volatility and price movement. For example, round numbers like $50 or $100 often see heightened trading activity due to their psychological significance. Understanding these levels helps traders make informed decisions, as they can anticipate potential reversals or breakouts when prices approach these key areas. Incorporating psychological levels into technical indicators can enhance the accuracy of day trading strategies.
What are the benefits of using multiple time frames in technical analysis?
Using multiple time frames in technical analysis helps traders gain a comprehensive view of market trends and price movements. It allows for better confirmation of signals; for instance, a bullish signal on a 15-minute chart might align with a daily uptrend. This approach enhances entry and exit strategies by providing a clearer context for trades. It also helps identify potential support and resistance levels more accurately. Overall, multiple time frames improve decision-making and reduce the risk of false signals in day trading stocks.
How can day traders adapt their strategies based on market volatility?
Day traders can adapt their strategies to market volatility by using technical indicators like the Average True Range (ATR) to gauge price movement. In high volatility, consider widening stop-loss orders to avoid being stopped out prematurely. Use Bollinger Bands to identify potential breakouts or reversals, adjusting entry and exit points accordingly. During low volatility, focus on tighter spreads and smaller targets, utilizing indicators like the Relative Strength Index (RSI) to spot overbought or oversold conditions. Always stay flexible and adjust your risk management strategies based on current market conditions.
Conclusion about Leveraging Technical Indicators for Day Trading Stocks
Incorporating technical indicators is essential for effective day trading. By understanding and utilizing tools like moving averages, RSI, and Bollinger Bands, traders can enhance their strategies and make informed decisions. Awareness of common pitfalls and the significance of backtesting can further refine one’s approach. With the right techniques, including trend identification and the use of multiple time frames, day traders can navigate market volatility more effectively. For comprehensive insights and support, DayTradingBusiness is here to guide you through your trading journey.
Learn about Technical Indicators for Forex Day Trading