Did you know that some day traders treat their ETFs like a buffet—sampling a bit of everything until something tasty catches their eye? In this article, we’ll dive into the essentials of analyzing ETFs for day trading, covering their mechanics, selection criteria, key metrics, and the importance of liquidity and volatility. You’ll learn how to assess performance, navigate risks, and leverage technical analysis, all while avoiding common pitfalls. We’ll also explore the best strategies, tools, and timeframes, so you can maximize your trading success. Join us at DayTradingBusiness to sharpen your ETF day trading skills and make the most of your investments!
What are ETFs and how do they work for day trading?
ETFs, or exchange-traded funds, are investment funds that are traded on stock exchanges like individual stocks. They hold a collection of assets, such as stocks, bonds, or commodities.
For day trading, ETFs offer liquidity and diversification. Traders buy and sell ETFs throughout the day, capitalizing on price fluctuations. To analyze ETFs for day trading, focus on volume, volatility, and market trends. High trading volume indicates liquidity, making it easier to enter and exit positions. Look for ETFs with significant price movements to maximize profit potential. Use technical analysis, such as charts and indicators, to identify entry and exit points.
Keep an eye on news and economic indicators that may impact the underlying assets in the ETF. This helps in making informed trading decisions.
How do I choose the best ETFs for day trading?
To choose the best ETFs for day trading, focus on liquidity, volatility, and expense ratios. Look for ETFs with high average trading volume to ensure easy entry and exit. Select those with significant price fluctuations throughout the day for better profit potential. Check the expense ratio; lower costs mean higher returns on quick trades. Analyze the underlying assets and sector performance to spot trends. Finally, use technical analysis tools to identify entry and exit points effectively.
What key metrics should I analyze for ETFs in day trading?
Analyze these key metrics for ETFs in day trading:
1. Volume: Look for high trading volume to ensure liquidity.
2. Price Movement: Monitor price volatility to identify potential profit opportunities.
3. Bid-Ask Spread: A narrow spread indicates lower trading costs.
4. Market Cap: Focus on larger ETFs for stability and consistent movement.
5. Tracking Error: Check how closely the ETF tracks its index; lower is better.
6. Expense Ratio: Lower costs mean more profit potential.
7. News and Events: Stay updated on relevant news that could impact ETF prices.
How does liquidity affect ETF day trading?
Liquidity impacts ETF day trading significantly. High liquidity means tighter bid-ask spreads, allowing traders to enter and exit positions quickly without substantial price changes. This reduces trading costs and increases the potential for profit. Low liquidity can lead to wider spreads, making it harder to execute trades at desired prices, increasing risk. Day traders should focus on ETFs with high average daily trading volumes to ensure efficient trading and minimize slippage.
What role does volatility play in ETF day trading?
Volatility is crucial in ETF day trading because it creates price movement, allowing traders to capitalize on short-term fluctuations. High volatility increases the potential for profit but also elevates risk. Traders often look for ETFs with significant daily price swings to find entry and exit points. Additionally, volatility can signal market sentiment, helping traders make informed decisions. In essence, understanding volatility helps day traders identify opportunities and manage risk effectively.
How can I assess ETF performance for day trading?
To assess ETF performance for day trading, focus on these key factors:
1. Liquidity: Check the average daily trading volume; higher liquidity means easier entry and exit.
2. Volatility: Analyze price fluctuations; look for ETFs with significant intraday movement to capitalize on short-term trades.
3. Bid-Ask Spread: A narrower spread indicates lower transaction costs, which is crucial for day trading.
4. Technical Indicators: Use indicators like moving averages, RSI, and MACD to identify trends and potential entry or exit points.
5. Market News: Stay updated on news affecting the ETF’s underlying assets, as this can impact short-term price movements.
6. Sector Performance: Monitor the performance of sectors the ETF represents; strong sector performance can drive ETF gains.
By concentrating on these aspects, you can effectively assess ETFs for day trading opportunities.
What are the risks of day trading ETFs?
The risks of day trading ETFs include high volatility, which can lead to significant losses in a short time. Liquidity issues can cause slippage, impacting your ability to buy or sell at desired prices. Additionally, market fluctuations and economic news can affect ETF prices unpredictably. Overtrading can lead to increased transaction costs, eating into profits. Lastly, emotional decision-making can result in impulsive trades that deviate from your strategy.
How do I use technical analysis for ETF day trading?
To use technical analysis for ETF day trading, start by identifying key chart patterns and trends. Use tools like moving averages to determine the ETF's direction. Look for support and resistance levels to set entry and exit points. Utilize indicators like RSI and MACD to gauge momentum and potential reversals. Monitor volume to confirm trends and signals. Set stop-loss orders to manage risk. Finally, stay updated on market news that may impact ETF prices.
How Can I Analyze and Choose the Best ETFs for Day Trading?
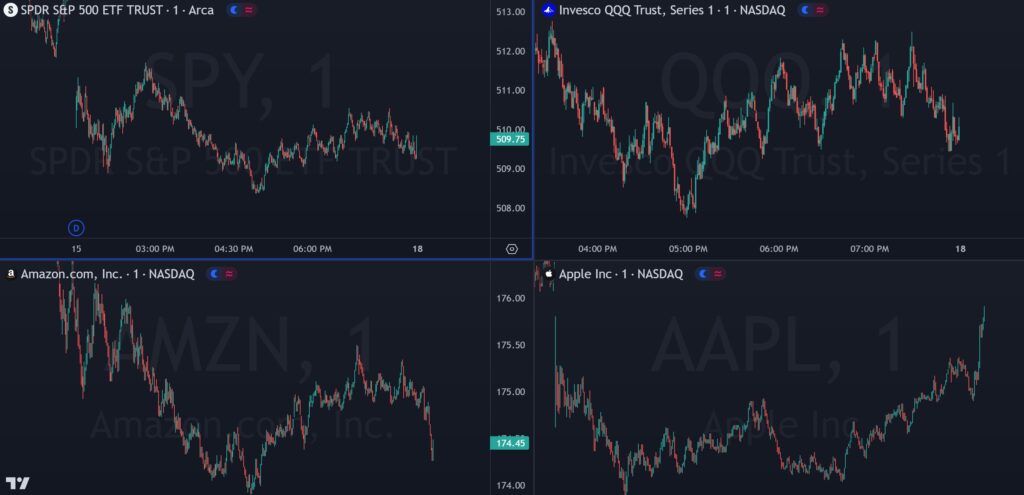
The best ETFs for day trading typically have high liquidity, low expense ratios, and volatility. Look for those with high average daily trading volumes, tight bid-ask spreads, and significant price movement. Popular options include SPDR S&P 500 ETF (SPY), Invesco QQQ Trust (QQQ), and iShares Russell 2000 ETF (IWM). To analyze ETFs for day trading, focus on technical indicators, price trends, and market news that may impact volatility.
Learn more about: What Are the Best ETFs for Day Trading?
What are the best trading strategies for ETFs?
The best trading strategies for ETFs include:
1. Technical Analysis: Use charts and indicators like moving averages, RSI, and MACD to identify trends and entry/exit points.
2. Momentum Trading: Focus on ETFs with strong price movements and high volume. Buy during upward trends and sell quickly to capitalize on momentum.
3. Mean Reversion: Identify overbought or oversold ETFs and trade on the assumption that prices will revert to their average.
4. Sector Rotation: Shift investments based on sector performance. Monitor economic indicators to predict which sectors will outperform.
5. News Trading: React quickly to news events affecting specific sectors or the broader market. Use economic reports and corporate announcements to guide trades.
6. Swing Trading: Hold ETFs for a few days or weeks, capitalizing on short to medium-term price movements.
7. Pair Trading: Trade correlated ETFs, going long on one while shorting the other to hedge against market risk.
Each strategy requires careful analysis and risk management tailored to your trading style.
How do I select the right timeframes for day trading ETFs?
To select the right timeframes for day trading ETFs, focus on these key steps:
1. Define Your Strategy: Determine whether you prefer scalping (short-term trades) or momentum trading (holding for a few hours).
2. Use Multiple Timeframes: Analyze charts in different timeframes—like 1-minute, 5-minute, and 15-minute—to identify trends and entry points.
3. Look for Volatility: Choose timeframes that align with periods of higher volatility, typically during market open or major news releases.
4. Consider Liquidity: Ensure the ETFs you trade have enough volume in your chosen timeframe to avoid slippage.
5. Test and Adjust: Start with a timeframe and adjust based on your comfort and the ETF’s behavior. Track your performance and refine as needed.
By combining these factors, you can effectively select timeframes that maximize your trading potential in ETFs.
Learn about How to Choose the Right Day Trading Strategy
What tools and platforms are best for analyzing ETFs?
For analyzing ETFs for day trading, use these tools and platforms:
1. TradingView: Offers advanced charting, technical analysis, and community insights.
2. Thinkorswim by TD Ameritrade: Provides in-depth research, real-time data, and customizable charts.
3. Yahoo Finance: Good for quick analysis, news, and performance tracking.
4. Morningstar: Useful for fundamental analysis and detailed ETF ratings.
5. MetaTrader 4/5: Popular for technical analysis and automated trading strategies.
Combine these tools to assess price movements, volume trends, and market news for effective day trading.
How do news and events impact ETF day trading?
News and events significantly impact ETF day trading by influencing market sentiment and volatility. Positive news can drive prices up, while negative news often leads to declines. Traders should monitor economic reports, earnings releases, and geopolitical events, as these can cause rapid price movements. Volume spikes often accompany such news, providing opportunities for quick trades. Additionally, sector-specific news can affect related ETFs, making it crucial to analyze news in the context of the ETFs being traded. Use real-time news feeds and economic calendars to stay informed and react swiftly.
What are the tax implications of day trading ETFs?
Day trading ETFs can lead to short-term capital gains, which are taxed at your ordinary income tax rate. If you hold an ETF for less than a year, profits are taxed higher than long-term investments. Additionally, frequent trading may trigger a wash sale rule, impacting your ability to deduct losses. Always consider state taxes and reporting requirements for your trades. Keeping accurate records is essential for tax reporting.
Learn about Tax Implications of Forex Day Trading
How can I set effective stop-loss orders for ETFs?
To set effective stop-loss orders for ETFs, first determine your risk tolerance and the maximum loss you're willing to accept. Use technical analysis to identify key support levels and set your stop-loss just below these points. Consider the ETF's volatility; tighter stops for less volatile ETFs and wider stops for more volatile ones. Regularly review and adjust your stop-loss levels as the trade progresses. Finally, avoid emotional decisions—stick to your plan.
What common mistakes should I avoid when day trading ETFs?
Avoid these common mistakes when day trading ETFs:
1. Ignoring Volume: Always check the trading volume. Low volume can lead to slippage and difficulty executing trades.
2. Neglecting Technical Analysis: Relying solely on news or fundamentals can be risky. Use charts and indicators to identify entry and exit points.
3. Overtrading: Don’t force trades. Stick to your strategy and avoid making impulsive decisions based on emotions.
4. Poor Risk Management: Set stop-loss orders to protect your capital. Never risk more than you can afford to lose.
5. Lack of a Trading Plan: Enter each trading day with a clear plan. Define your goals, strategies, and criteria for trades.
6. Ignoring Market Conditions: Be aware of broader market trends. Day trading an ETF that’s moving against the market can lead to losses.
7. Failure to Adapt: Markets change. Stay flexible and adjust your strategies based on current market behavior.
By avoiding these pitfalls, you can enhance your day trading success with ETFs.
Learn about Common Mistakes in Day Trading Scalping and How to Avoid Them
How can I track my ETF day trading performance?
To track your ETF day trading performance, use these steps:
1. Set Up a Trading Journal: Record each trade with details like entry and exit points, position size, and reasons for the trade.
2. Use Trading Software: Utilize platforms like Thinkorswim or TradeStation, which offer performance tracking tools and analytics.
3. Monitor Key Metrics: Focus on metrics like win/loss ratio, average gain/loss per trade, and overall return on investment (ROI).
4. Analyze Charts: Regularly review the ETF charts for trends, volume changes, and price movements to assess your trading strategy's effectiveness.
5. Review Regularly: Weekly or monthly, analyze your trades to identify patterns, strengths, and areas for improvement.
By consistently tracking these elements, you'll gain insights into your ETF trading performance.
Conclusion about How to Analyze ETFs for Day Trading
In conclusion, effectively analyzing ETFs for day trading requires a comprehensive understanding of their mechanics, metrics, and market dynamics. By focusing on liquidity, volatility, and technical analysis, traders can better assess potential opportunities. It’s essential to implement sound strategies and avoid common pitfalls while staying informed about market events. For those seeking in-depth insights and support, DayTradingBusiness offers valuable resources to enhance your trading journey.
Learn about How to Analyze Day Trading Performance
Sources:
- Can Day Trading Really Be Profitable?
- Beat the Market An Effective Intraday Momentum Strategy for ...
- Intraday return predictability: Evidence from commodity ETFs and ...
- Can ETFs mitigate stock Co-movement? An analysis of an emerging ...
- Arbitrage and Liquidity: Evidence from a Panel of Exchange Traded ...