Did you know that even a sloth can move faster than a stock on a bad day? In the fast-paced world of trading, understanding momentum is crucial for success. This article dives into the essentials of momentum indicators in technical analysis, explaining their significance for traders. We cover various types of momentum indicators, including the Relative Strength Index (RSI), Moving Average Convergence Divergence (MACD), and Stochastic Oscillator, detailing their calculations and interpretations. You’ll also learn how to identify overbought and oversold conditions, explore the advantages and limitations of these tools, and discover how to effectively combine them with other technical indicators. Get ready to enhance your trading strategies with insights from DayTradingBusiness that will help you navigate the market's momentum like a pro!
What are momentum indicators in technical analysis?
Momentum indicators in technical analysis measure the speed and strength of price movements. They help traders identify potential reversals or continuations in trends. Common momentum indicators include the Relative Strength Index (RSI), Moving Average Convergence Divergence (MACD), and Stochastic Oscillator. These tools signal whether an asset is overbought or oversold, assisting in making informed trading decisions.
How do momentum indicators help traders?
Momentum indicators help traders identify the strength and direction of price movements. They signal potential buy or sell opportunities by showing whether an asset is overbought or oversold. Common indicators like the Relative Strength Index (RSI) and Moving Average Convergence Divergence (MACD) provide insights into price momentum, helping traders make informed decisions. By analyzing these indicators, traders can anticipate reversals or continuations in trends, enhancing their trading strategies and risk management.
What are the most common types of momentum indicators?
The most common types of momentum indicators include the Relative Strength Index (RSI), Moving Average Convergence Divergence (MACD), Stochastic Oscillator, and Rate of Change (ROC). RSI measures the speed and change of price movements, MACD shows the relationship between two moving averages, Stochastic Oscillator compares a stock's closing price to its price range, and ROC calculates the percentage change in price over a specific period. These indicators help traders assess market momentum and potential reversal points.
How is the Relative Strength Index (RSI) calculated?
The Relative Strength Index (RSI) is calculated using the following steps:
1. Calculate Average Gain and Average Loss: Over a specified period (commonly 14 days), find the average gains and average losses.
2. Compute the Relative Strength (RS): RS = Average Gain / Average Loss.
3. Calculate RSI: RSI = 100 – (100 / (1 + RS)).
The final value ranges from 0 to 100, indicating overbought or oversold conditions.
What does the RSI indicate about market conditions?
RSI, or Relative Strength Index, indicates whether a market is overbought or oversold. An RSI above 70 suggests overbought conditions, signaling a potential price correction. Conversely, an RSI below 30 indicates oversold conditions, hinting at a possible price rebound. Traders use RSI to assess momentum and make informed decisions about buying or selling assets.
How do you interpret the Moving Average Convergence Divergence (MACD)?
To interpret the Moving Average Convergence Divergence (MACD), look at three key components: the MACD line, the signal line, and the histogram.
1. MACD Line: This is the difference between the 12-day and 26-day exponential moving averages (EMAs). When the MACD line crosses above the signal line (the 9-day EMA of the MACD line), it indicates a bullish signal. Conversely, a cross below suggests a bearish signal.
2. Signal Line: This helps confirm MACD signals. If the MACD line is above the signal line, it shows momentum is shifting upward. Below indicates downward momentum.
3. Histogram: This represents the difference between the MACD line and the signal line. A growing histogram indicates increasing momentum in the direction of the MACD line, while a shrinking histogram suggests weakening momentum.
Use these components together to evaluate momentum in a stock or market trend. Look for divergence between the MACD and price action for potential reversals.
What role does Stochastic Oscillator play in momentum trading?
The Stochastic Oscillator helps identify momentum shifts in trading by comparing a security's closing price to its price range over a specific period. It generates values between 0 and 100, indicating overbought (above 80) or oversold (below 20) conditions. Traders use it to spot potential reversals or continuation in trends, making it a crucial tool for assessing momentum in the market. By analyzing these signals, traders can make informed decisions about entry and exit points.
How Do Technical Indicators Enhance Day Trading Momentum Strategies?
Day trading momentum strategies involve buying stocks that are trending upward and selling those that are trending downward, capitalizing on short-term price movements. Key technical indicators for evaluating momentum include the Relative Strength Index (RSI), Moving Average Convergence Divergence (MACD), and Bollinger Bands. These tools help traders identify overbought or oversold conditions and potential entry or exit points in the market.
Learn more about: What Are Day Trading Momentum Strategies?
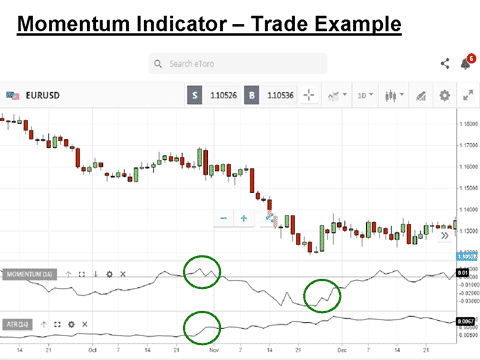
How can Average True Range (ATR) indicate momentum?
Average True Range (ATR) indicates momentum by measuring market volatility. A rising ATR suggests increasing volatility, which often accompanies strong price movements. When ATR increases alongside price direction, it confirms momentum. Conversely, a declining ATR can signal weakening momentum. Traders often use ATR to set stop-loss levels and gauge trade potential based on volatility.
What are the advantages of using momentum indicators?
Momentum indicators help traders identify the strength and direction of a trend. They signal potential reversals or continuations, allowing for timely entry and exit points. By measuring the speed of price changes, indicators like the Relative Strength Index (RSI) or Moving Average Convergence Divergence (MACD) provide insights into overbought or oversold conditions. This helps in making informed decisions, reducing emotional trading. Additionally, momentum indicators can enhance risk management by indicating when to tighten stops or take profits.
How do you identify overbought and oversold conditions with momentum indicators?
To identify overbought and oversold conditions using momentum indicators, focus on the Relative Strength Index (RSI) and Stochastic Oscillator.
1. RSI: Look for values above 70 to indicate overbought conditions and below 30 for oversold conditions. This indicates potential reversals.
2. Stochastic Oscillator: A reading above 80 suggests overbought, while below 20 indicates oversold. Watch for crossovers in these zones for confirmation.
Use these indicators in conjunction with price action for more accurate signals.
What are the limitations of momentum indicators in trading?
Momentum indicators can be misleading during volatile markets, resulting in false signals. They often lag behind price movements, causing late entries or exits. Overbought or oversold conditions can persist longer than expected, leading traders to make premature decisions. Additionally, momentum indicators may not account for fundamental changes affecting the asset, reducing their reliability. They also tend to work better in trending markets and can give poor results in sideways or choppy conditions. Lastly, using them in isolation can lead to a lack of a comprehensive trading strategy.
How can you combine momentum indicators with other technical tools?
Combine momentum indicators with other technical tools by using them alongside trend indicators like moving averages to confirm trends. For example, if a momentum indicator shows bullish momentum while the price is above a moving average, it reinforces a buy signal. Additionally, use support and resistance levels to identify entry and exit points. If momentum is increasing near support, it can signal a potential bounce. Pairing momentum indicators with volume analysis can also provide insights; increased volume with rising momentum suggests strong buying interest.
What is the difference between leading and lagging momentum indicators?
Leading momentum indicators signal potential future price movements by providing early entry points, like the Relative Strength Index (RSI) or Stochastic Oscillator. They help traders anticipate changes before they happen.
Lagging momentum indicators, such as Moving Averages or the MACD, confirm trends after they’ve started, helping traders identify the strength of a move. They’re useful for validating existing trends but may result in late entries.
In short, leading indicators predict, while lagging indicators confirm.
How do divergences in momentum indicators signal potential reversals?
Divergences in momentum indicators signal potential reversals by highlighting discrepancies between price movement and momentum. For example, if prices are making new highs but the momentum indicator is not, it suggests weakening strength, indicating a possible reversal. Conversely, if prices hit new lows while the momentum indicator rises, it signals that selling pressure may be easing, hinting at a potential upward reversal. These divergences act as warning signs, prompting traders to reassess their positions before entering or exiting trades.
What strategies can traders use with momentum indicators?
Traders can use several strategies with momentum indicators:
1. Crossovers: Buy when a short-term momentum indicator crosses above a long-term one, and sell when it crosses below.
2. Divergence: Identify discrepancies between price movement and momentum indicators. A price increase with falling momentum signals a potential reversal.
3. Overbought/Oversold Levels: Use indicators like RSI or Stochastic to determine when an asset is overbought (sell signal) or oversold (buy signal).
4. Trend Confirmation: Combine momentum indicators with trend indicators to confirm the strength of a trend before entering a trade.
5. Breakout Confirmation: Use momentum indicators to confirm breakouts from key levels. A surge in momentum can indicate a strong move following a breakout.
6. Trailing Stops: Implement trailing stops based on momentum to lock in profits while allowing for potential upside as long as momentum remains strong.
Each of these strategies leverages the insights momentum indicators provide, helping traders make informed decisions.
How do market conditions affect the reliability of momentum indicators?
Market conditions significantly impact the reliability of momentum indicators. In trending markets, momentum indicators can effectively signal buy or sell opportunities as they follow price movements. However, during sideways or choppy markets, these indicators may generate false signals, leading to potential losses. High volatility can also cause momentum indicators to react too quickly, resulting in unreliable readings. Thus, understanding current market conditions is crucial for interpreting momentum indicators accurately.
Conclusion about Evaluating Momentum: Technical Indicators Explained
In summary, momentum indicators are essential tools in technical analysis that help traders assess market trends and make informed decisions. By understanding various indicators such as the RSI, MACD, and Stochastic Oscillator, traders can identify overbought or oversold conditions, recognize potential reversals, and enhance their day trading strategies. While these indicators offer significant advantages, it’s crucial to acknowledge their limitations and the impact of market conditions on their reliability. Leveraging insights from DayTradingBusiness can further refine your trading approach, ensuring a more strategic and informed engagement in the markets.
Sources:
- Skewness preference and the popularity of technical analysis ...
- Technical indicators for energy market trading - ScienceDirect
- Profitability of Momentum Strategies: An Evaluation of Alternative ...
- Innovation indicators throughout the innovation process: An ...
- Artificial intelligence techniques in financial trading: A systematic ...