Did you know that the stock market can sometimes feel like a roller coaster—thrilling one moment and terrifying the next? Understanding market reversals is crucial for traders looking to capitalize on these shifts. This article delves into the essentials of market reversals, including how to analyze them, the impact of economic indicators, and the technical analysis tools that can aid in identifying potential reversals. We’ll explore the importance of historical data, market sentiment, and volume trends, along with key patterns and signs that signal bullish or bearish reversals. Additionally, we’ll discuss the role of support and resistance levels and how Fibonacci retracement can enhance your analysis. Avoid common pitfalls and learn effective strategies to implement after recognizing a market reversal. Let's navigate the complexities of trading with insights from DayTradingBusiness.
What Are Market Reversals and How Can They Be Analyzed?
Market reversals are points where the direction of a price trend changes, shifting from bullish to bearish or vice versa. To analyze market reversals, look for key indicators such as trend lines, support and resistance levels, and chart patterns like head and shoulders or double tops/bottoms. Use technical analysis tools like moving averages and MACD to identify momentum shifts. Additionally, volume analysis can confirm reversals; increased volume during a price change often signals a stronger reversal. Keep an eye on market sentiment and news events, as they can also trigger reversals.
How Do Economic Indicators Affect Market Reversals?
Economic indicators, like GDP growth, unemployment rates, and inflation, signal the health of the economy. Positive indicators can boost investor confidence, leading to market rallies, while negative indicators might trigger sell-offs and market corrections. For instance, rising unemployment can signal economic weakness, prompting investors to exit positions. Conversely, strong GDP growth can lead to bullish market conditions. When these indicators change direction, they often precede market reversals, as investors recalibrate expectations based on new data. Understanding these trends helps anticipate shifts in market sentiment and potential reversals.
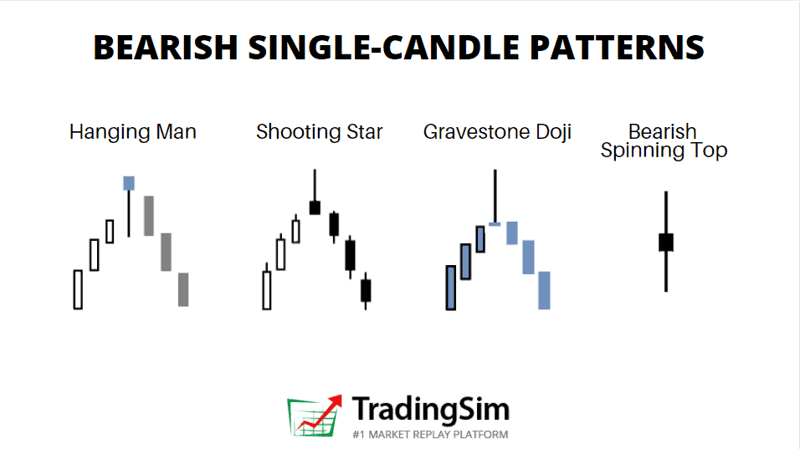
What Technical Analysis Tools Help Identify Market Reversals?
To identify market reversals, use these technical analysis tools:
1. Candlestick Patterns: Look for reversal patterns like hammers, shooting stars, and engulfing candles.
2. Support and Resistance Levels: Identify key price levels where reversals often occur.
3. Moving Averages: Use crossovers of short-term and long-term moving averages to spot potential reversals.
4. Relative Strength Index (RSI): An RSI above 70 indicates overbought conditions; below 30 suggests oversold conditions.
5. MACD (Moving Average Convergence Divergence): Watch for MACD line crossovers for potential trend reversals.
6. Fibonacci Retracement Levels: These levels can indicate potential reversal points during a pullback.
7. Volume Analysis: Increased volume during a price reversal can confirm the strength of the move.
Incorporate these tools to enhance your market reversal analysis.
How Can Historical Data Be Used to Predict Market Reversals?
Historical data can predict market reversals by identifying patterns, trends, and key indicators. Analysts look for price levels where past reversals occurred, using tools like support and resistance lines. Moving averages can signal potential shifts when they cross, indicating a change in momentum. Volume analysis also helps; spikes in trading volume often precede reversals. Additionally, sentiment analysis of historical news and investor behavior can reveal overbought or oversold conditions, suggesting an impending reversal. By combining these data points, traders can make informed decisions about potential market reversals.
What Role Do Market Sentiment and Psychology Play in Reversals?
Market sentiment and psychology are crucial in reversals because they influence traders' perceptions and decisions. When sentiment shifts from fear to optimism, or vice versa, it can trigger a change in price direction. For example, if traders panic during a downturn, selling pressure increases, often leading to a reversal when the sentiment shifts toward a buying opportunity. Additionally, psychological levels, like support and resistance, can amplify these shifts as traders react to collective emotions and behavior. Understanding these dynamics helps predict when and why reversals may occur.
How Do Volume Trends Influence Market Reversal Signals?
Volume trends can indicate market reversal signals by showing shifts in buying and selling pressure. An increase in volume during a price decline suggests strong selling, potentially signaling a bottom. Conversely, if volume rises during a price increase, it indicates strong buying interest, which may precede a peak. Divergences between price movement and volume trends, such as rising prices on declining volume, often hint at weakening momentum and potential reversals. Monitoring these trends helps traders identify when to enter or exit positions effectively.
What Patterns Indicate a Potential Market Reversal?
Key patterns indicating a potential market reversal include:
1. Head and Shoulders: This pattern signals a bullish-to-bearish reversal.
2. Double Tops/Bottoms: A double top suggests a bearish reversal, while a double bottom indicates a bullish reversal.
3. Divergence: When price moves in one direction while indicators like RSI or MACD move in the opposite direction, it can signal a reversal.
4. Candlestick Patterns: Specific candles, like pin bars or engulfing patterns, can indicate potential reversals.
5. Support and Resistance Levels: Breaks or bounces at these levels often precede reversals.
6. Volume Changes: A significant change in trading volume during price movements can indicate strength behind a reversal.
Monitor these indicators closely to identify potential market changes.
How Can Trendlines Be Utilized to Spot Market Reversals?
Trendlines help spot market reversals by identifying key support and resistance levels. When prices approach these lines, a bounce or break can signal a potential reversal. A break above a downward trendline suggests a bullish reversal, while a break below an upward trendline indicates a bearish reversal. Additionally, observing multiple touches on a trendline strengthens its significance. Combining trendlines with other indicators, like volume and momentum, enhances the accuracy of reversal predictions.
What Are the Key Signs of a Bullish Market Reversal?
Key signs of a bullish market reversal include:
1. Higher Lows: Prices consistently make higher lows, indicating increasing buying pressure.
2. Increased Volume: A significant rise in trading volume during price increases suggests strong investor interest.
3. Bullish Candlestick Patterns: Patterns like hammer, engulfing, or morning star signal potential reversals.
4. Divergence: If price declines while indicators like RSI or MACD show upward momentum, a reversal may be near.
5. Support Levels: Prices bouncing off established support levels can indicate a shift from bearish to bullish sentiment.
6. Positive News or Economic Data: Favorable news or economic indicators can trigger renewed investor confidence.
7. Market Sentiment Shift: A change in sentiment from fear to optimism often precedes a bullish reversal.
Watch for these signs to identify potential bullish market reversals.
What Are the Key Signs of a Bearish Market Reversal?
Key signs of a bearish market reversal include:
1. Lower Highs and Lower Lows: A consistent pattern of declining peaks and troughs.
2. Increased Selling Volume: Higher volumes on down days indicate stronger bearish sentiment.
3. Bearish Divergence: When prices rise, but momentum indicators (like RSI) fall, signaling weakness.
4. Moving Average Crossovers: A short-term moving average crossing below a long-term average can indicate a trend change.
5. Negative News Sentiment: Increasing negative news coverage or economic indicators can shift market psychology.
6. Resistance Levels: Frequent failures to break through established resistance levels often precede declines.
Monitor these signs for potential market shifts.
How Do Different Asset Classes Respond to Market Reversals?
Different asset classes respond to market reversals in unique ways. Equities often drop sharply during reversals, reflecting investor sentiment shifts. Bonds typically gain value as investors seek safety, driving yields down. Commodities can be volatile; for example, gold often rises as a safe haven, while oil may decline due to reduced demand. Real estate may lag, responding slower as market conditions change. Each asset class has distinct characteristics that influence its reaction to market reversals, driven by factors like investor behavior and economic indicators.
What Is the Importance of Support and Resistance Levels in Reversals?
Support and resistance levels are crucial for identifying potential reversals in the market. Support levels indicate where buying interest may emerge, potentially halting a price decline. Conversely, resistance levels suggest where selling pressure could arise, possibly reversing an uptrend. Traders use these levels to make informed decisions, as a break below support or above resistance often signals stronger momentum in the prevailing direction. Recognizing these points helps in setting entry and exit strategies, enhancing risk management, and improving overall trading outcomes.
How Can Traders Use Fibonacci Retracement for Reversal Analysis?
Traders can use Fibonacci retracement for reversal analysis by identifying key levels where price may reverse after a pullback. First, draw the Fibonacci levels from the recent swing high to swing low. Key levels to watch are 23.6%, 38.2%, 50%, 61.8%, and 78.6%.
Once these levels are plotted, observe price action around them. Look for candlestick patterns or volume spikes that indicate a potential reversal. For example, if the price bounces off the 61.8% level with a bullish engulfing candle, it could signal a strong reversal.
Additionally, combine Fibonacci retracement with other technical indicators, like RSI or MACD, to confirm your analysis. This multi-faceted approach enhances the reliability of the reversal signal.
What Are Common Mistakes to Avoid When Analyzing Market Reversals?
Common mistakes to avoid when analyzing market reversals include:
1. Ignoring volume trends: Low volume can signal weak reversals.
2. Relying solely on one indicator: Use a combination of indicators for confirmation.
3. Failing to consider market context: Analyze broader market conditions, not just price action.
4. Overtrading: Entering positions too quickly can lead to losses.
5. Neglecting risk management: Always set stop-loss orders to protect against unexpected moves.
6. Confirmation bias: Avoid sticking to preconceived notions; stay objective.
7. Misinterpreting patterns: Ensure patterns align with other signals before acting.
8. Chasing after missed opportunities: Focus on solid setups rather than impulsive trades.
Staying aware of these pitfalls can enhance your market reversal analysis.
How Can I Analyze Market Conditions to Identify Day Trading Reversal Strategies?
To analyze market conditions for reversals in day trading, look for key indicators such as support and resistance levels, candlestick patterns, and volume spikes. Monitor technical indicators like RSI or MACD for divergence signals. Use news events and economic data releases to gauge market sentiment. Always confirm signals with multiple indicators before making a trade.
Learn more about: Understanding Day Trading Reversal Strategies
Learn about How to Identify Reversal Patterns in Day Trading
How Can News Events Impact Market Reversal Predictions?

News events can significantly impact market reversal predictions by influencing investor sentiment and behavior. Positive news may lead to increased buying pressure, suggesting a potential reversal from a downtrend. Conversely, negative news can trigger panic selling, reinforcing a downtrend. Economic indicators, geopolitical developments, and corporate earnings reports can all create volatility, affecting traders' expectations. Understanding these news events helps in analyzing market conditions and predicting potential reversals.
What Strategies Can Be Implemented After Identifying a Market Reversal?
1. Adjust Positioning: Shift your investments to align with the new market trend, either by increasing long positions in a bullish reversal or short positions in a bearish reversal.
2. Implement Stop-Loss Orders: Protect your capital by placing stop-loss orders to minimize losses if the reversal doesn’t hold.
3. Diversify Investments: Spread your risk across different asset classes or sectors that may benefit from the reversal.
4. Monitor Technical Indicators: Use tools like moving averages, RSI, or MACD to confirm the reversal and time your entries or exits effectively.
5. Stay Informed: Keep abreast of news and economic indicators that could influence the market and validate the reversal.
6. Reassess Risk Tolerance: Evaluate your risk appetite in light of the new market conditions and adjust your strategy accordingly.
7. Take Partial Profits: If you’re already in a position, consider taking partial profits to lock in gains while allowing the rest to run with the trend.
8. Utilize Options: Consider options strategies like buying calls or puts to leverage your position without significant capital exposure.
Conclusion about Analyzing Market Conditions for Reversals
In conclusion, understanding market reversals is crucial for successful trading. By analyzing economic indicators, utilizing technical analysis tools, and considering market sentiment, traders can better anticipate potential reversals. Historical data and volume trends further enhance predictive capabilities, while patterns and support/resistance levels provide key insights. Recognizing bullish and bearish signals is essential, as is applying tools like Fibonacci retracement. Avoiding common mistakes can significantly improve analysis accuracy. With the right strategies, traders can effectively capitalize on market reversals and enhance their day trading performance. For deeper insights and support in your trading journey, DayTradingBusiness is here to help.