Did you know that in the world of crypto, a single tweet can cause price patterns more dramatic than a soap opera finale? In the fast-paced realm of crypto day trading, recognizing patterns is crucial for making informed decisions. This article dives into the common patterns traders encounter, from bullish and bearish signals to key chart indicators. You'll learn how volume impacts patterns, the importance of support and resistance levels, and how to spot trends. We also cover candlestick patterns, moving averages, and the nuances of altcoin trading. Plus, discover common mistakes to avoid and tools to enhance your strategy. With insights from DayTradingBusiness, you'll be well-equipped to identify and leverage patterns in the ever-evolving crypto market.
What are the common patterns in crypto day trading?
Common patterns in crypto day trading include:
1. Breakouts: Price moves above resistance levels, signaling potential upward trends.
2. Reversals: Sudden changes in price direction at support or resistance levels, indicating a potential trend reversal.
3. Flags and Pennants: Short-term continuation patterns that suggest a pause before the previous trend resumes.
4. Head and Shoulders: A reversal pattern indicating a potential change in trend direction, often followed by a price drop.
5. Cup and Handle: A bullish continuation pattern where the price forms a rounded bottom followed by a consolidation period.
Traders look for these patterns to make informed buy or sell decisions.
How can I recognize bullish and bearish patterns in crypto?
To recognize bullish patterns in crypto, look for formations like ascending triangles, cup and handles, and double bottoms. These indicate potential upward momentum. For bearish patterns, watch for descending triangles, head and shoulders, and double tops, signaling possible downward trends. Use volume analysis to confirm these patterns; increased volume during breakouts supports the trend. Also, pay attention to candlestick patterns like bullish engulfing or bearish engulfing, as they provide quick insights into market sentiment.
What indicators help identify trading patterns in cryptocurrencies?
Key indicators for identifying trading patterns in cryptocurrencies include:
1. Moving Averages: Look for crossovers (e.g., the 50-day crossing above the 200-day) to spot trends.
2. Relative Strength Index (RSI): Use RSI to determine overbought or oversold conditions, indicating potential reversals.
3. Bollinger Bands: Monitor price action relative to the bands for breakout signals.
4. Volume: Analyze volume spikes to confirm the strength of a pattern.
5. MACD: Watch for MACD line crossovers and divergences for trend changes.
6. Candlestick Patterns: Identify formations like hammers or engulfing patterns for reversal signals.
7. Chart Patterns: Recognize formations such as head and shoulders, triangles, and flags for trend continuation or reversal.
Combining these indicators enhances your ability to predict price movements effectively.
How does volume affect crypto trading patterns?
Volume significantly influences crypto trading patterns by indicating market activity and participant interest. High volume often correlates with strong price movements, signaling momentum. When volume spikes, it can confirm trends or reversals, helping traders identify entry and exit points. Low volume may suggest weak interest, leading to less reliable price movements and potential false breakouts. Analyzing volume alongside price charts allows traders to spot patterns like breakouts, consolidations, and support or resistance levels effectively.
What are the key chart patterns for crypto day traders?
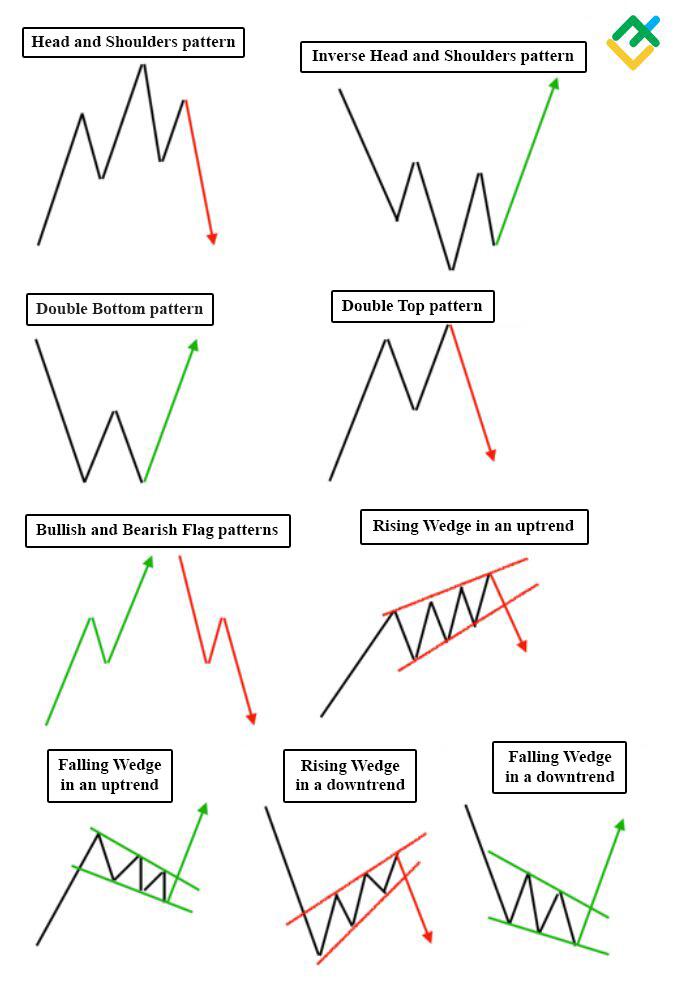
Key chart patterns for crypto day traders include:
1. Head and Shoulders: Indicates potential trend reversals; look for a peak (head) between two smaller peaks (shoulders).
2. Double Top and Bottom: Double top signals a bearish reversal; double bottom indicates a bullish reversal.
3. Triangles (Ascending, Descending, Symmetrical): Show consolidation; breakout direction can signal future price movement.
4. Flags and Pennants: Short-term continuation patterns; flags are rectangular, while pennants are triangular.
5. Cup and Handle: Suggests bullish continuation; looks like a cup followed by a consolidation period (handle).
Monitor volume alongside these patterns for confirmation.
How can I use candlestick patterns in crypto trading?
To use candlestick patterns in crypto trading, start by learning key patterns like doji, engulfing, and hammer. Identify these patterns on your price charts to gauge market sentiment. For example, a bullish engulfing pattern can signal a potential price increase, while a bearish doji may indicate indecision.
Combine candlestick patterns with volume analysis for better confirmation. Look for patterns at key support and resistance levels to enhance your trading decisions. Always use risk management strategies, like stop-loss orders, to protect your investments. Regularly practice and analyze historical data to improve your pattern recognition skills.
What role do moving averages play in identifying trading patterns?
Moving averages smooth out price data to identify trends in crypto day trading. They help traders spot support and resistance levels, determine entry and exit points, and confirm bullish or bearish patterns. Short-term moving averages react quickly to price changes, while long-term averages provide a broader trend perspective. Crossovers between different moving averages, like the 50-day and 200-day, signal potential buy or sell opportunities. Overall, they enhance decision-making by filtering out market noise and revealing underlying patterns.
How can I spot trends in crypto day trading?
To spot trends in crypto day trading, focus on these key strategies:
1. Chart Analysis: Use candlestick charts to identify patterns like head and shoulders or triangles. Look for trend lines that indicate upward or downward movements.
2. Volume Indicators: Monitor trading volume alongside price changes. Increased volume can signal a strong trend.
3. Moving Averages: Apply short-term moving averages (like the 5 or 10-day) to see where prices are trending. Crossovers can indicate buy or sell signals.
4. Market Sentiment: Follow news, social media, and forums to gauge trader sentiment. Positive or negative news can lead to rapid price changes.
5. Technical Indicators: Use tools like the Relative Strength Index (RSI) or MACD to identify overbought or oversold conditions.
6. Timeframes: Analyze different timeframes (1-minute, 5-minute, hourly) to capture short-term trends and reversals.
By combining these techniques, you can effectively identify trends in crypto day trading.
What is the significance of support and resistance levels in crypto patterns?
Support and resistance levels are crucial in crypto day trading because they indicate where the price tends to reverse or consolidate. Support acts as a price floor, where buying interest often increases, while resistance serves as a ceiling, where selling pressure typically rises. Identifying these levels helps traders make informed decisions about entry and exit points, manage risk, and set stop-loss orders. Recognizing patterns around these levels can signal potential breakouts or reversals, enhancing trading strategies and improving profitability.
How do I identify reversal patterns in cryptocurrency trading?
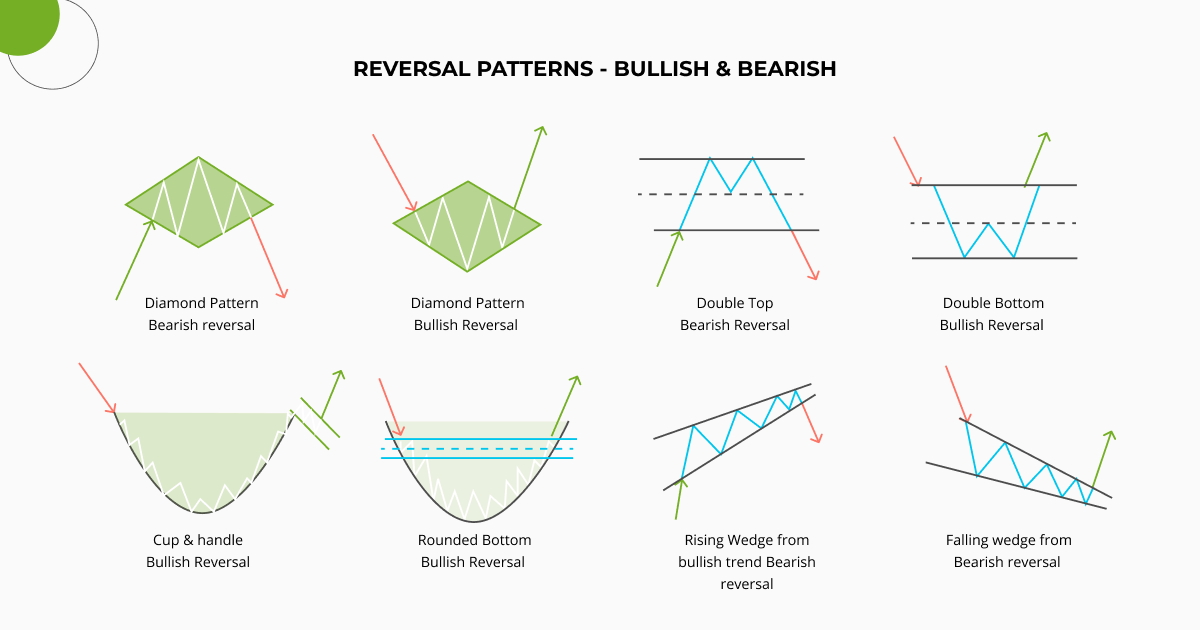
To identify reversal patterns in cryptocurrency trading, look for key formations on price charts such as head and shoulders, double tops, double bottoms, and bullish or bearish engulfing candles. Use technical indicators like RSI and MACD to confirm these patterns. Monitor volume spikes, as they often accompany reversals. Pay attention to support and resistance levels; a break from these can signal a potential reversal. Always combine pattern recognition with broader market analysis for better accuracy.
Learn about How to Identify Reversal Patterns in Day Trading
What are the common mistakes in recognizing crypto trading patterns?
Common mistakes in recognizing crypto trading patterns include:
1. Overlooking Volume: Ignoring trading volume can lead to misinterpretation of a pattern's strength.
2. Confirmation Bias: Seeking information that supports preconceived notions while dismissing contradictory data can skew analysis.
3. Ignoring Market Sentiment: Not considering broader market sentiment can result in misreading patterns.
4. Relying Solely on Historical Data: Patterns may not repeat; focusing too much on past performance can be misleading.
5. Neglecting Time Frames: Using inappropriate time frames can distort pattern recognition; shorter and longer time frames can tell different stories.
6. Failing to Adapt: Sticking rigidly to established patterns without adapting to new market conditions can lead to losses.
7. Misinterpreting Noise: Confusing random price movements with actual patterns can lead to false signals.
Avoid these pitfalls to improve accuracy in crypto day trading.
Learn about Common Mistakes in Crypto Day Trading
How can I backtest patterns in crypto day trading?
To backtest patterns in crypto day trading, follow these steps:
1. Select a Trading Platform: Use platforms like TradingView or MetaTrader that offer historical data and backtesting features.
2. Identify Patterns: Choose specific patterns to test, such as head and shoulders, triangles, or candlestick formations.
3. Gather Historical Data: Download historical price data for the cryptocurrencies you want to analyze.
4. Set Up Backtesting Criteria: Define entry and exit points based on your chosen patterns, including stop-loss and take-profit levels.
5. Run Backtests: Use the platform's backtesting tool to apply your criteria to historical data, noting the outcomes.
6. Analyze Results: Review the performance metrics, such as win rate, average return, and drawdown, to evaluate the effectiveness of the patterns.
7. Refine Your Strategy: Adjust your parameters based on results and retest to improve accuracy.
By following these steps, you can effectively backtest patterns in crypto day trading to refine your strategies.
How Can You Identify Patterns to Choose the Best Crypto Markets for Day Trading?
To choose the best crypto markets for day trading, look for high liquidity, low spreads, and volatility. Identify patterns in price movements, such as support and resistance levels, and use technical analysis tools like moving averages and RSI to spot trends. Focus on markets with active trading volumes and a variety of trading pairs to maximize opportunities.
Learn more about: How to Choose the Best Crypto Markets for Day Trading
Learn about How to Choose the Best Crypto Markets for Day Trading
What tools can assist in identifying patterns for crypto trading?
Tools that can assist in identifying patterns for crypto trading include:
1. Technical Analysis Software: Platforms like TradingView and MetaTrader provide charting tools and indicators to spot trends and patterns.
2. Pattern Recognition Tools: Tools like Coinigy and PatternSmart can automatically identify patterns like flags, triangles, and head and shoulders.
3. Algorithmic Trading Bots: Bots such as 3Commas and Cryptohopper analyze market data and execute trades based on predefined patterns.
4. Market Sentiment Analysis: Services like The TIE and Santiment track social media and news sentiment, helping identify patterns in trader behavior.
5. Backtesting Tools: Programs like QuantConnect and TradingView allow users to test trading strategies against historical data to see how patterns would have performed.
Using these tools can enhance your ability to recognize patterns and make informed trading decisions.
How do news events influence crypto trading patterns?

News events directly impact crypto trading patterns by triggering price volatility and influencing trader sentiment. Positive news, like regulatory approvals or major partnerships, often leads to price surges as traders buy in anticipation of future gains. Conversely, negative news, such as hacks or regulatory crackdowns, can cause panic selling, driving prices down.
Traders often react quickly to breaking news, leading to rapid shifts in trading volume and patterns. For instance, a major exchange listing can create a spike in interest and trading activity. Monitoring news events helps traders identify potential opportunities and risks, shaping their strategies in real-time.
Learn about How to Stay Updated on Crypto Market News for Day Trading
What patterns are specific to altcoin day trading?
Specific patterns in altcoin day trading include:
1. Breakout Patterns: Look for price movements above resistance levels, indicating potential upward momentum.
2. Flag and Pennant Patterns: These indicate a brief consolidation before a continuation of the previous trend.
3. Volume Spikes: High trading volume often precedes significant price changes, signaling potential entry or exit points.
4. Support and Resistance Levels: Frequent testing of these levels can create predictable buying or selling opportunities.
5. Chart Patterns: Head and shoulders, double tops, and bottoms frequently appear, hinting at trend reversals.
Monitoring these patterns helps traders make informed decisions in the fast-paced altcoin market.
How can I develop my own strategy based on trading patterns?
To develop your own strategy based on trading patterns in crypto day trading, start by identifying key patterns like flags, triangles, or head and shoulders on price charts. Use technical analysis tools to spot these formations and observe how they historically perform. Backtest your strategy using historical data to see how well it would have worked. Set clear entry and exit points based on your chosen patterns, and use stop-loss orders to manage risk. Keep a trading journal to analyze your trades, refine your strategy, and adapt to market changes. Finally, stay updated on market news, as it can influence pattern effectiveness.
Learn about How to Develop Your Own Scalping Strategy for Day Trading
Conclusion about Identifying Patterns in Crypto Day Trading
In conclusion, mastering pattern recognition in crypto day trading is essential for success. By understanding common bullish and bearish patterns, leveraging technical indicators, and analyzing volume, traders can make informed decisions. Utilizing tools like moving averages and candlestick patterns further enhances this process. Avoiding common mistakes and backtesting strategies can significantly improve trading outcomes. For comprehensive guidance and resources, DayTradingBusiness is here to support your journey in identifying profitable trading patterns and strategies.