Did you know that the average day trader spends more time staring at charts than a cat does napping? In the fast-paced world of futures trading, understanding key indicators is crucial for success. This article dives into essential tools like moving averages, volume, and RSI that can significantly enhance your trading strategy. We’ll explore how MACD, Bollinger Bands, and ATR play pivotal roles in decision-making, as well as the importance of Fibonacci retracement, trend signaling indicators, and candlestick patterns. Additionally, we’ll discuss the impact of economic news and psychological factors on trading. Join us at DayTradingBusiness to sharpen your skills and avoid common pitfalls in the dynamic futures market.
What are the key indicators for day trading futures?
Key indicators for day trading futures include:
1. Volume: High trading volume indicates strong interest and can signal potential price movements.
2. Price Action: Analyzing candlestick patterns helps identify trends and reversals.
3. Moving Averages: Use short-term moving averages (like the 5 or 10-day) to spot trends.
4. Relative Strength Index (RSI): This momentum oscillator indicates overbought or oversold conditions.
5. Bollinger Bands: These show volatility and potential price breakouts.
6. Fibonacci Retracement Levels: Useful for identifying support and resistance levels.
7. Economic Indicators: Reports like employment data or GDP can affect market sentiment.
Focus on these indicators to enhance your day trading strategies in the futures market.
How do moving averages help in day trading futures?
Moving averages help in day trading futures by smoothing out price data, making it easier to identify trends. Traders use short-term moving averages, like the 10 or 20-period, to spot quick price shifts and potential entry points. Longer-term moving averages, such as the 50 or 200-period, can signal overall market direction. Crossovers between different moving averages can indicate buy or sell signals. Additionally, moving averages can act as dynamic support or resistance levels, guiding traders on where to set stop-loss orders or take profits.
What is the role of volume in futures trading?
Volume in futures trading indicates the number of contracts traded within a specific period. It helps traders gauge market activity, liquidity, and potential price movements. High volume often signals strong interest and can confirm trends, while low volume may suggest indecisiveness. Traders use volume alongside price action to identify entry and exit points, as well as potential reversals. Monitoring volume patterns can enhance decision-making and risk management in day trading futures.
How can RSI be used in day trading futures?
RSI, or Relative Strength Index, is a momentum indicator that helps day traders identify overbought or oversold conditions in futures markets. To use RSI in day trading futures, look for the following:
1. Identify Overbought/Oversold Levels: An RSI above 70 indicates overbought conditions, while below 30 signals oversold conditions. This can suggest potential reversals.
2. Divergence: Watch for divergence between RSI and price movements. If prices are making new highs but RSI is not, it could indicate a potential reversal.
3. Entry and Exit Points: Use RSI to time entries and exits. For example, consider buying when RSI crosses above 30 and selling when it crosses below 70.
4. Combine with Other Indicators: Enhance your strategy by pairing RSI with other indicators like moving averages or MACD for confirmation.
By applying RSI effectively, you can make more informed trading decisions in the fast-paced futures market.
What is the significance of MACD in futures trading?

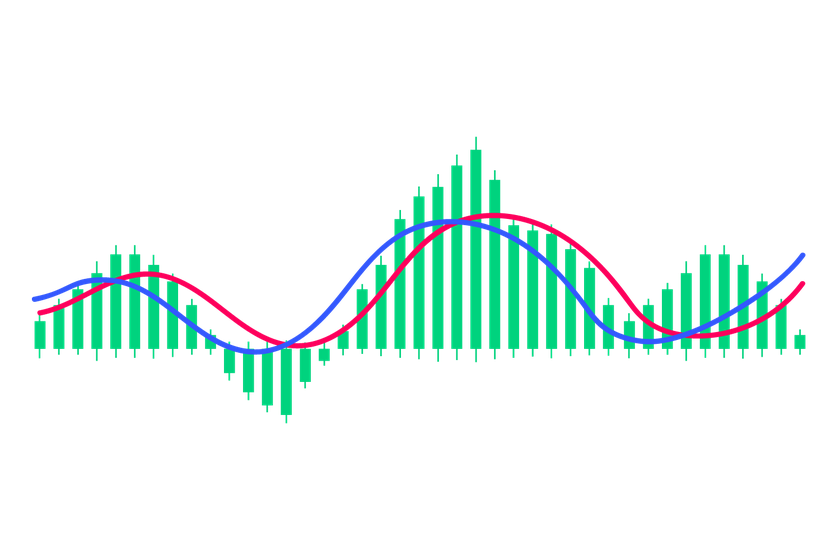
The MACD (Moving Average Convergence Divergence) is significant in futures trading because it helps traders identify momentum, trend direction, and potential reversals. By analyzing the MACD line and signal line crossover, traders can spot buy or sell signals. The histogram provides insight into the strength of the trend, allowing for better entry and exit points. Overall, MACD enhances decision-making by highlighting changes in momentum, crucial for day trading futures efficiently.
How do Bollinger Bands assist day traders in futures?
Bollinger Bands help day traders in futures by providing a visual representation of price volatility and market trends. When the bands widen, it indicates increased volatility, signaling potential trading opportunities. Traders often look for price breaks above the upper band as a signal to sell or below the lower band to buy. Additionally, when prices hover around the bands, it can suggest a potential reversal. Using Bollinger Bands in conjunction with other indicators enhances decision-making for day trading futures.
Why is the ATR important for day trading futures?
The Average True Range (ATR) is crucial for day trading futures because it measures market volatility. Traders use ATR to set stop-loss orders and determine position sizing. A higher ATR indicates more volatility, suggesting wider stops, while a lower ATR allows for tighter stops. This helps manage risk effectively and optimize trade entries and exits. By understanding ATR, traders can adapt their strategies to varying market conditions, enhancing their chances of success.
How can traders use Fibonacci retracement in futures?
Traders can use Fibonacci retracement in futures by identifying key levels where prices might reverse or consolidate. First, determine the recent high and low on the price chart. Then, apply Fibonacci levels—typically 23.6%, 38.2%, 50%, 61.8%, and 76.4%—to the vertical distance between these points. Watch for price action around these levels; if the price bounces off a Fibonacci level, it may indicate a good entry point for a trade. Use additional indicators, like volume or candlestick patterns, to confirm potential reversals and enhance trading decisions.
What indicators signal market trends for futures trading?
Key indicators for futures trading trends include:
1. Price Action: Watch for higher highs and lower lows to identify bullish or bearish trends.
2. Volume: Increased trading volume often confirms a trend; declining volume may signal a reversal.
3. Moving Averages: Use short-term and long-term moving averages to spot trend direction and potential reversals.
4. Relative Strength Index (RSI): An RSI above 70 indicates overbought conditions, while below 30 suggests oversold conditions, signaling potential trend changes.
5. Bollinger Bands: Price touching the upper band can indicate overbought conditions, while touching the lower band can indicate oversold conditions.
6. Fibonacci Retracement Levels: These can identify potential support and resistance levels during a trend.
7. Economic Indicators: Reports like GDP, employment data, and interest rates can influence market sentiment and trend direction.
Monitoring these indicators helps traders make informed decisions in the futures market.
How do candlestick patterns inform day trading decisions?
Candlestick patterns provide visual insights into market sentiment, helping day traders identify potential price reversals or continuations. Patterns like dojis indicate indecision, while engulfing patterns suggest strong momentum. Traders use these signals to time entries and exits, set stop-loss levels, and gauge overall market direction. For example, a bullish engulfing pattern after a downtrend can prompt a buy, while a bearish engulfing after an uptrend may signal a sell. Recognizing these patterns enhances decision-making, allowing traders to capitalize on short-term price movements effectively.
Learn about How to Identify Reversal Patterns in Day Trading
What are the best chart patterns for futures day trading?

The best chart patterns for futures day trading include:
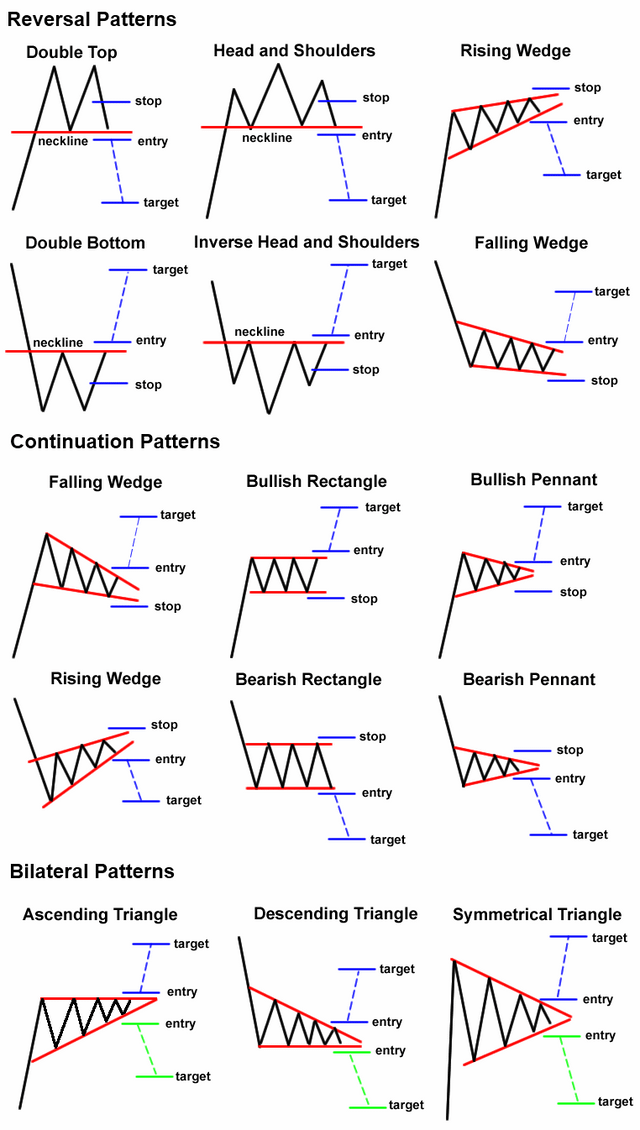
1. Head and Shoulders: Indicates potential reversals; look for breakouts.
2. Double Tops and Bottoms: Signals trend reversals; confirm with volume.
3. Triangles (Ascending, Descending, Symmetrical): Show consolidation; breakout direction is key.
4. Flags and Pennants: Indicate continuation; trade in the direction of the prevailing trend.
5. Cup and Handle: Suggests bullish continuation; watch for breakout above the handle.
Utilize these patterns with volume and momentum indicators for better accuracy in your trading strategy.
How do economic indicators impact futures trading?
Economic indicators impact futures trading by influencing market sentiment and price movements. Key indicators like GDP, employment reports, inflation rates, and consumer confidence can signal economic health. For example, a strong employment report may boost optimism, leading to higher prices in stock index futures. Conversely, rising inflation can drive commodity futures prices up as traders anticipate increased costs. Traders watch these indicators closely to make informed decisions, using them to predict market trends and adjust their strategies accordingly.
What role does news play in day trading futures?
News plays a crucial role in day trading futures by influencing market sentiment and volatility. Economic reports, earnings releases, and geopolitical events can cause rapid price movements, creating opportunities for traders. Staying updated on breaking news helps traders anticipate market shifts and make informed decisions. Key indicators to watch include employment data, inflation reports, and central bank announcements, as these can directly impact futures prices. Quick reactions to news can lead to profitable trades or significant losses, making it essential for day traders to integrate news analysis into their strategy.
Learn about The Role of News in Day Trading Decisions
What Are the Key Indicators for Trading Futures in Day Trading?
Futures in day trading are contracts to buy or sell an asset at a predetermined price at a specified future date. Traders use these contracts to speculate on price movements of commodities, currencies, or indices, aiming to profit from short-term fluctuations.
Learn more about: What Are Futures in Day Trading?
Learn about Key Indicators for Day Trading Reversals
How can traders utilize support and resistance levels in futures?

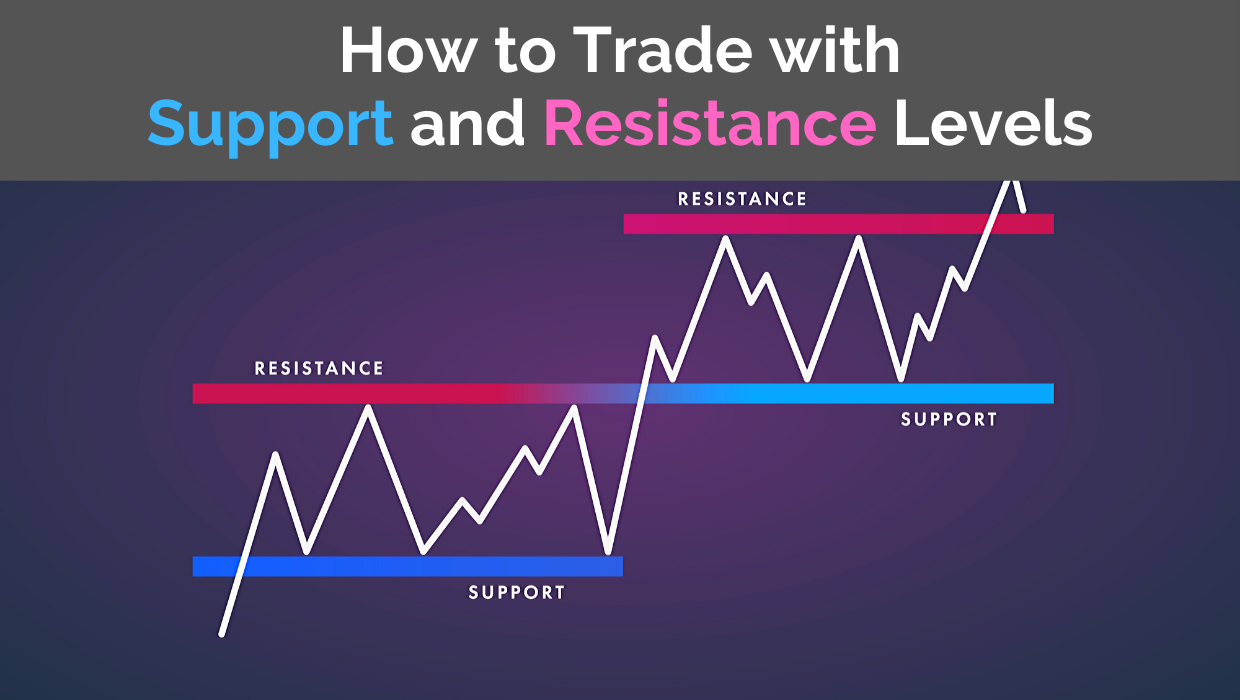
Traders can utilize support and resistance levels in futures by identifying key price points where the market tends to reverse or consolidate. When the price approaches a support level, traders can look for buying opportunities, anticipating a bounce. Conversely, at resistance levels, they might consider selling or shorting, expecting a price drop.
Using charts, traders can draw horizontal lines at these levels to visualize potential entry and exit points. Combining support and resistance with other indicators, like moving averages or volume, enhances decision-making. For day trading, monitoring these levels in real-time can help traders capitalize on short-term price movements effectively.
What are the common mistakes with indicators in futures trading?
Common mistakes with indicators in futures trading include over-reliance on a single indicator, ignoring market context, and using lagging indicators without confirming price action. Traders often misinterpret signals, fail to adapt to changing market conditions, and overlook the importance of volume. Additionally, not backtesting strategies or practicing risk management can lead to significant losses. It's crucial to combine indicators with a solid trading plan and to remain disciplined.
How do psychological indicators affect day trading in futures?
Psychological indicators significantly impact day trading in futures by influencing traders' decision-making and emotional responses. Fear can lead to premature selling, while greed might cause traders to hold onto positions too long. Overconfidence can result in taking excessive risks, while anxiety can trigger hesitation. Successful day traders often rely on self-awareness and emotional discipline to manage these psychological factors, maintaining a clear strategy and sticking to their trading plan. Recognizing and mitigating the effects of these indicators can enhance performance and improve trading outcomes.
Conclusion about Essential Indicators for Day Trading Futures
Incorporating essential indicators is crucial for successful day trading in futures. Understanding how moving averages, volume, RSI, MACD, and other tools can guide your trading decisions will enhance your strategy. Additionally, being aware of market trends, economic factors, and psychological influences can significantly impact your performance. By leveraging this knowledge and the resources provided by DayTradingBusiness, traders can navigate the complexities of futures trading with greater confidence and precision.
Sources:
- Intraday momentum in the VIX futures market - ScienceDirect
- Index futures volatility and trading activity: Measuring causality at a ...
- Intraday volatility predictability in china gold futures market: The ...
- The price discovery role of day traders in futures market: Evidence ...
- The impact of index futures crash risk on bitcoin futures returns and ...
- More is better? The impact of predictor choice on the INE oil futures ...