Did you know that the first trading chart was created in the 17th century, and it wasn't for stocks, but for rice? Fast forward to today, understanding futures price charts is crucial for traders aiming to navigate the complex world of futures trading. This article dives deep into the essentials of reading futures price charts, covering everything from basic components and candlestick patterns to the significance of support and resistance levels. You'll learn how to analyze trends, utilize moving averages, and interpret volume indicators effectively. Additionally, we explore technical indicators, price patterns, and the impact of news events on chart movements. By the end, you'll be equipped to develop a robust trading strategy with insights from DayTradingBusiness to enhance your trading skills.
What are futures price charts and why are they important?
Futures price charts are visual representations of the price movements of futures contracts over time. They display key information, including opening, closing, high, and low prices, often using line, bar, or candlestick formats.
These charts are important because they help traders identify trends, patterns, and potential reversal points in the market. By analyzing price movements, traders can make informed decisions about buying or selling futures contracts, manage risk, and optimize their trading strategies. Understanding how to read these charts is essential for effective trading in futures markets.
How do I interpret the basic components of a futures price chart?
To interpret a futures price chart, focus on these basic components:
1. Price Axis: The vertical axis shows the futures price. Identify where the current price sits relative to past prices.
2. Time Axis: The horizontal axis represents time. Look for trends over different periods—daily, weekly, or monthly.
3. Candlesticks: Each candlestick shows opening, closing, high, and low prices for a specific time frame. A filled candlestick indicates a price drop, while an empty one indicates a rise.
4. Volume: This indicates the number of contracts traded. Higher volume can signal strong interest in price movements.
5. Trends: Look for upward (bullish) or downward (bearish) trends. Connect the highs and lows to visualize the trend direction.
6. Support and Resistance Levels: Identify key price levels where the market has historically reversed. Support is where prices bounce up, and resistance is where they tend to fall.
By analyzing these components, you can make informed decisions based on price movements and market sentiment.
What do candlestick patterns indicate in futures trading?
Candlestick patterns in futures trading indicate market sentiment and potential price movements. They help traders identify trends, reversals, and continuation signals. For example, a bullish engulfing pattern suggests a possible upward reversal, while a bearish harami may signal a downward trend. Recognizing these patterns allows traders to make informed decisions based on visual cues from price charts.
How can I analyze trends using futures price charts?
To analyze trends using futures price charts, start by identifying the time frame you want to analyze, such as daily, weekly, or monthly. Look for patterns like higher highs and higher lows for uptrends, or lower highs and lower lows for downtrends. Use technical indicators like moving averages to smooth out price data and confirm trends. Pay attention to volume; increasing volume during a price movement can signal strength in that trend. Lastly, draw trendlines to visualize support and resistance levels, helping you understand potential reversal points.
What are support and resistance levels in futures price charts?
Support levels in futures price charts are price points where a downtrend tends to pause due to increased buying interest. Resistance levels are points where an uptrend often stalls because of heightened selling pressure. Traders use these levels to identify potential entry and exit points, anticipating price reversals or breakouts.
How do moving averages affect futures price chart analysis?

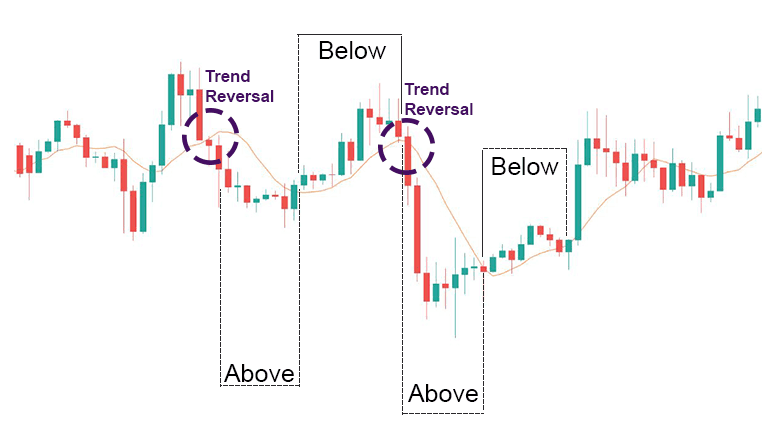
Moving averages smooth out price data to identify trends in futures price chart analysis. They help traders spot potential support and resistance levels. A rising moving average suggests an uptrend, while a falling one indicates a downtrend. Crossovers, where a short-term moving average crosses a long-term one, can signal entry or exit points. Overall, moving averages enhance clarity in price movements, making it easier to make informed trading decisions.
What role do volume indicators play in reading futures charts?
Volume indicators show the number of contracts traded during a specific time period, helping to confirm price movements in futures charts. High volume often indicates strong interest and can validate trends, while low volume might suggest weakness or uncertainty. For example, if prices rise with increasing volume, it signals strong buying interest. Conversely, if prices rise but volume declines, it may indicate a lack of conviction in the trend. Understanding volume helps traders make informed decisions about entry and exit points in the futures market.
How can I identify price patterns in futures trading?
To identify price patterns in futures trading, start by studying candlestick charts. Look for common patterns like head and shoulders, double tops/bottoms, and triangles. Use trend lines to connect highs and lows, revealing support and resistance levels. Apply indicators like moving averages or the Relative Strength Index (RSI) for additional context. Analyze volume alongside price movements to confirm patterns. Regularly practice interpreting charts to build your skills over time.
How Do You Read Futures Price Charts in Day Trading?
Futures in day trading are contracts to buy or sell an asset at a predetermined price on a future date. They allow traders to speculate on price movements of commodities, indices, or currencies. Futures can be leveraged, increasing both potential profits and risks.
Learn more about: What Are Futures in Day Trading?
What technical indicators should I use for futures price charts?

Use the following technical indicators for futures price charts:
1. Moving Averages (MA): Identify trends by using simple moving averages (SMA) or exponential moving averages (EMA) to smooth price data.
2. Relative Strength Index (RSI): Gauge momentum and identify overbought or oversold conditions, typically using a 14-period setting.
3. Bollinger Bands: Assess volatility and price levels by analyzing the band width and price interactions with the upper and lower bands.
4. MACD (Moving Average Convergence Divergence): Spot changes in momentum by tracking the relationship between two EMAs.
5. Volume: Monitor trading volume to confirm trends or reversals; rising volume often validates price movements.
6. Fibonacci Retracement: Identify potential support and resistance levels based on key Fibonacci ratios.
Incorporating these indicators can enhance your analysis of futures price charts.
How do I spot reversals on a futures price chart?
To spot reversals on a futures price chart, look for key indicators:
1. Candlestick Patterns: Identify patterns like hammers, shooting stars, or engulfing candles at support or resistance levels.
2. Trendlines: Watch for breaks in established trendlines. A break can signal a potential reversal.
3. Moving Averages: Look for crossovers. A short-term average crossing below a long-term average can indicate a bearish reversal, and vice versa.
4. Volume: Increased volume during a price move can confirm a reversal. If a reversal occurs with high volume, it’s more significant.
5. Divergence: Analyze momentum indicators like RSI or MACD. A divergence between price and these indicators can suggest a reversal.
Monitor these signs together for stronger confirmation of potential reversals on your futures price chart.
What is the significance of chart timeframes in futures trading?
Chart timeframes in futures trading are crucial because they determine the perspective you gain on market trends. Shorter timeframes (like 1-minute or 5-minute charts) help capture quick price movements and enable day trading strategies. Medium timeframes (like hourly or daily charts) provide insights into short to medium-term trends, useful for swing trading. Longer timeframes (such as weekly or monthly charts) reveal overarching market trends and help with long-term positioning. Choosing the right timeframe aligns your trading strategy with your goals and risk tolerance, ultimately enhancing decision-making and trade execution.
How can I use Fibonacci retracement in futures price charts?
To use Fibonacci retracement in futures price charts, follow these steps:
1. Identify a significant price movement: Look for a clear high and low on the chart.
2. Apply Fibonacci levels: Use the Fibonacci tool to draw lines from the high to the low (for a downtrend) or low to high (for an uptrend).
3. Analyze key levels: The main Fibonacci retracement levels are 23.6%, 38.2%, 50%, 61.8%, and 100%. Watch these levels for potential support or resistance.
4. Look for confirmation: Check for additional indicators or chart patterns at these levels to validate your analysis.
5. Plan your trades: Use these levels to set entry points, stop-loss orders, and profit targets.
By incorporating Fibonacci retracement, you can better understand potential price reversals in futures markets.
What is the difference between daily and intraday futures charts?
Daily futures charts display price movements over a 24-hour period, showing one data point per day. Intraday futures charts break down price movements into smaller time frames, like minutes or hours, providing more detail on market fluctuations throughout the trading day. Essentially, daily charts give a broader view for longer-term trends, while intraday charts focus on short-term price action and volatility.
How do news events impact futures price chart movements?

News events can significantly impact futures price chart movements by influencing market sentiment and perceived value. For example, a report on lower-than-expected crop yields can drive agricultural futures prices up as traders anticipate supply shortages. Conversely, positive economic data can lead to a drop in commodity prices as confidence increases in alternative investments. Traders often react quickly to news, causing sharp price fluctuations reflected on charts. Patterns like spikes or reversals can indicate how news is affecting market dynamics, making it crucial to consider news alongside technical analysis when reading futures price charts.
What common mistakes should I avoid when reading futures charts?
Avoid these common mistakes when reading futures charts:
1. Ignoring trend lines: Always identify and follow the prevailing trend; don’t trade against it.
2. Overcomplicating indicators: Use a few reliable indicators rather than cluttering your chart with too many.
3. Neglecting volume analysis: Volume can provide crucial context for price movements; consider it alongside price action.
4. Focusing solely on short-term data: Look at longer time frames to understand broader market trends.
5. Misinterpreting candlestick patterns: Learn the meanings of different candlestick formations to avoid false signals.
6. Lack of risk management: Always set stop-loss orders to protect against unexpected price swings.
7. Failing to consider news events: Major news can impact futures prices significantly; stay informed about relevant market news.
By avoiding these pitfalls, you can improve your futures trading decisions.
How can I develop a strategy based on futures price chart analysis?
To develop a strategy based on futures price chart analysis, start by identifying key trends using line charts, candlestick charts, or bar charts. Focus on support and resistance levels to determine entry and exit points. Use technical indicators like moving averages or RSI to confirm trends. Analyze volume patterns to gauge market strength. Finally, backtest your strategy on historical data to refine it before applying it in real-time trading.
Conclusion about How to Read Futures Price Charts
In conclusion, mastering the art of reading futures price charts is essential for effective trading. By understanding the fundamental components, interpreting candlestick patterns, analyzing trends, and identifying support and resistance levels, you can make informed decisions. Utilizing technical indicators and recognizing price patterns will further enhance your strategy. With the right approach and insights from resources like DayTradingBusiness, you can navigate the complexities of futures trading with confidence and precision.