Did you know that options trading can sometimes feel like deciphering ancient hieroglyphics? Understanding options chains is crucial for successful day trading, and this article breaks it down for you. We’ll explore what options chains are, how to read them effectively, and the key components like bid and ask prices, open interest, and volume. You’ll learn how to identify bullish or bearish signals, the importance of strike prices and expiration dates, and the role of implied volatility. Additionally, we’ll discuss the Greeks for deeper analysis, tools for efficiency, and strategies for risk management. With insights from DayTradingBusiness, you'll be equipped to practice and avoid common pitfalls in your trading journey. Let’s dive in!
What is an options chain in day trading?
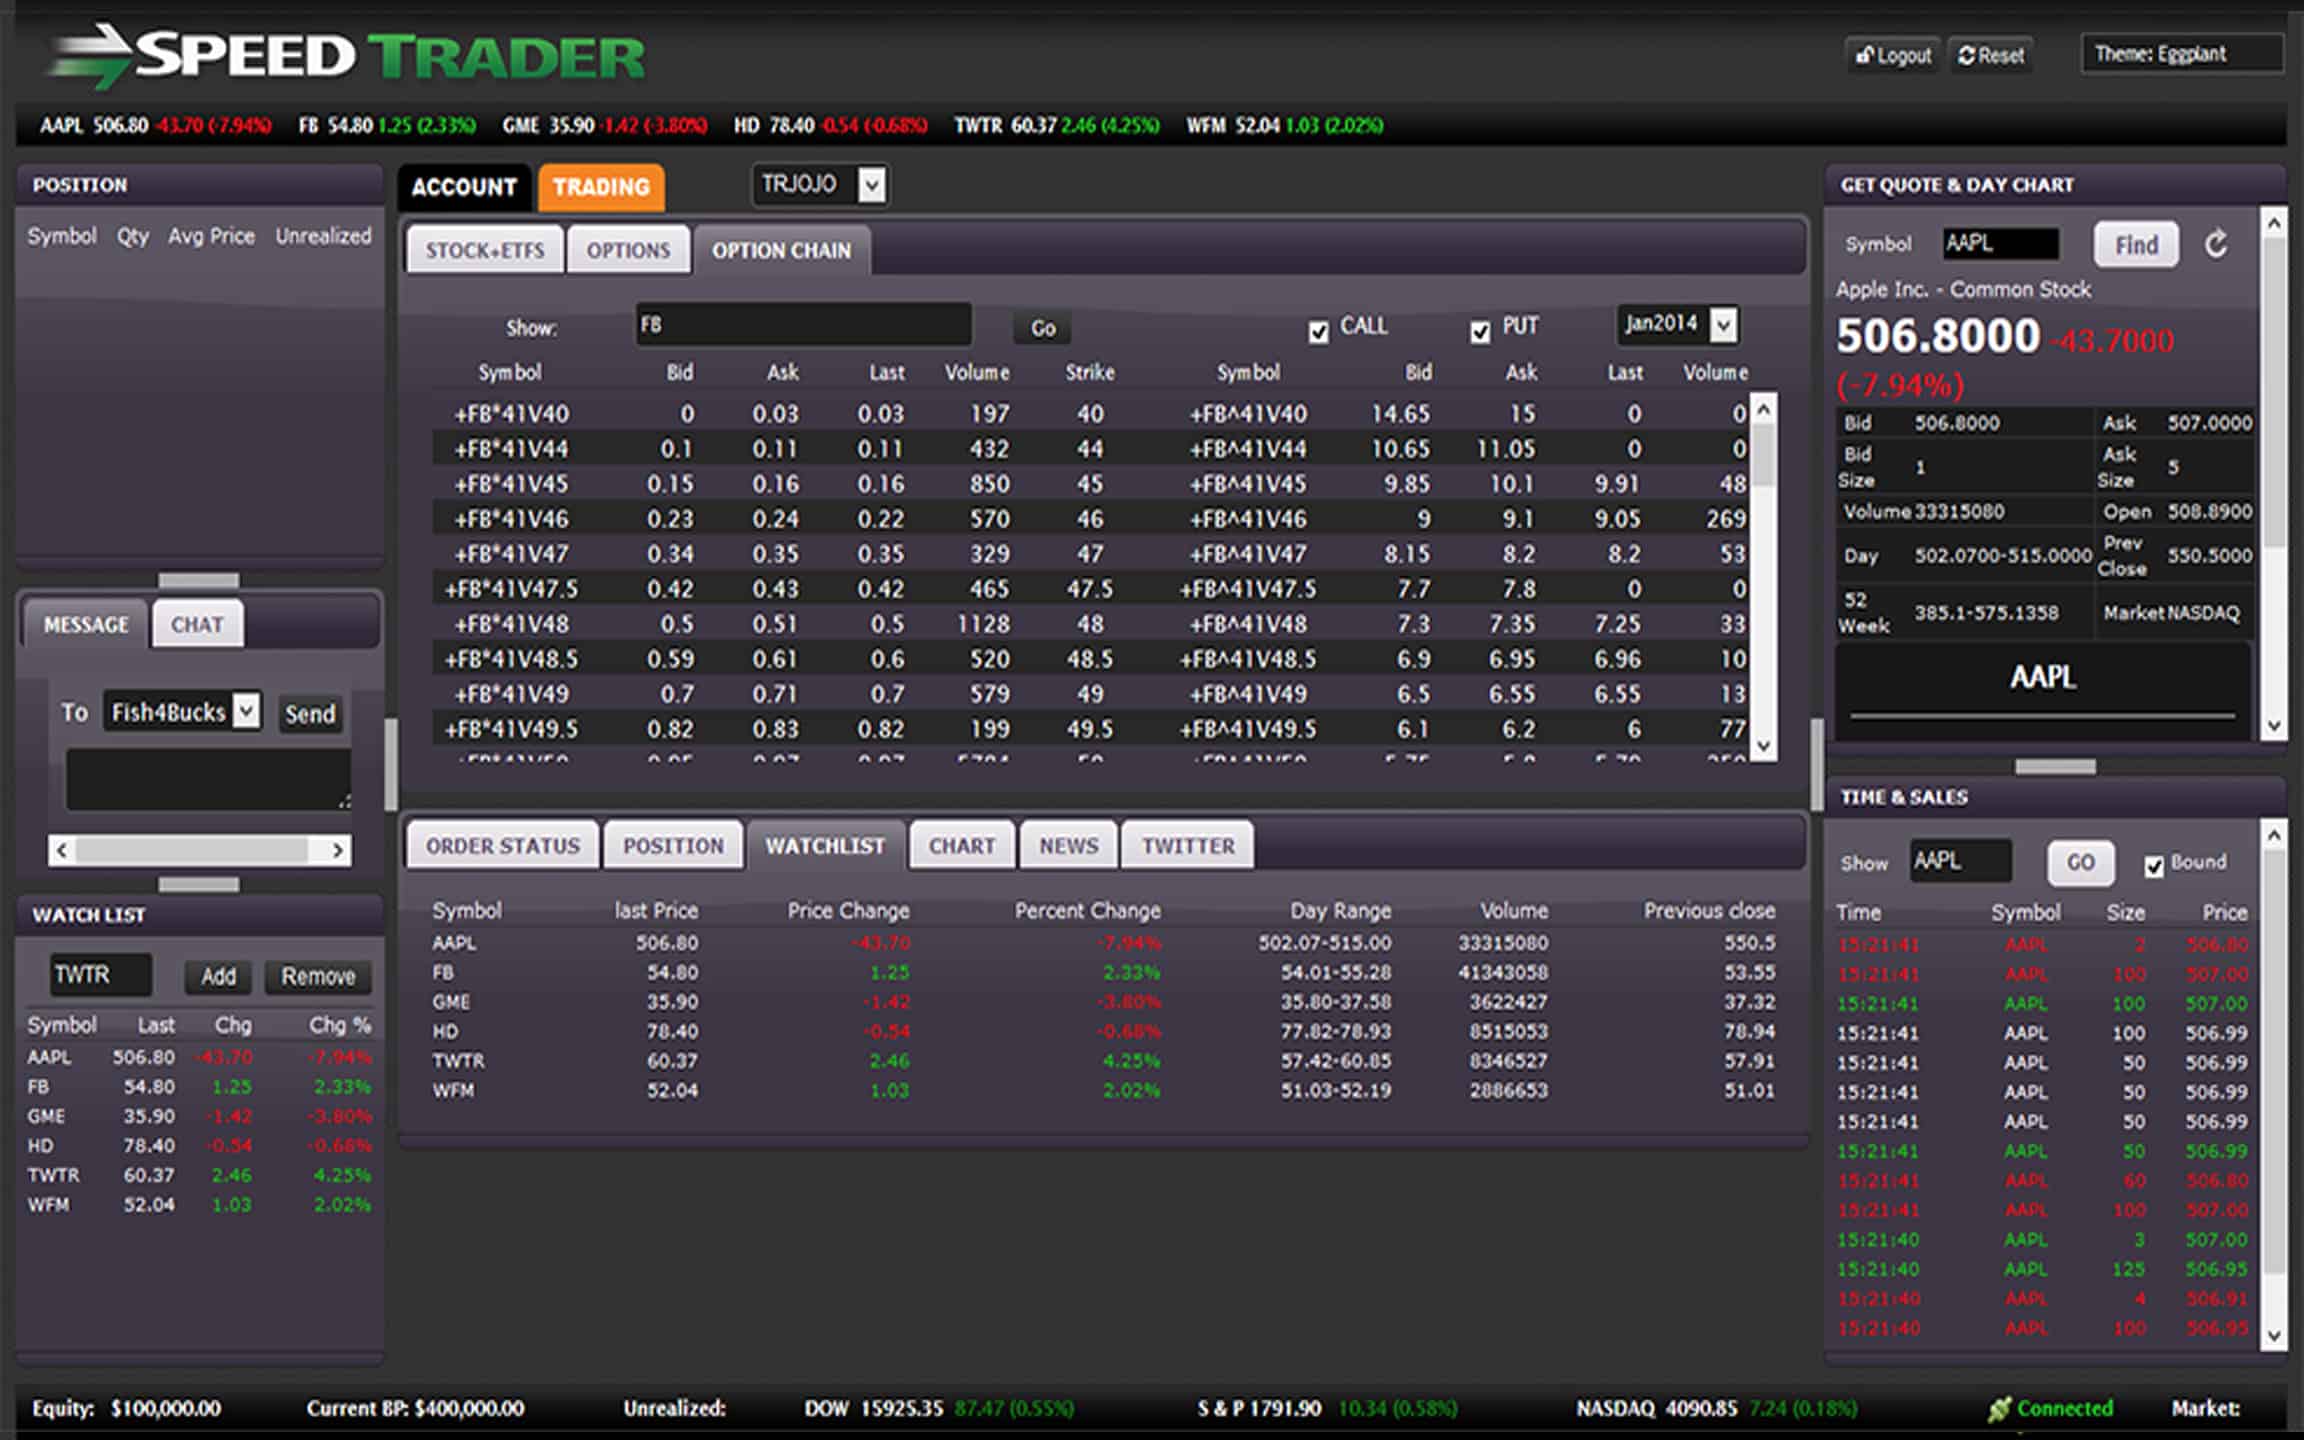
An options chain in day trading is a list of all available options contracts for a specific underlying asset, showing their strike prices, expiration dates, and premiums. To read an options chain, look at the call and put options separately.
For calls, identify the strike price and the premium, which indicates what you would pay for the option. For puts, do the same. Pay attention to volume and open interest; high numbers indicate liquidity and potential trading opportunities.
Check the bid-ask spread to gauge market demand. A narrow spread suggests a more active market, while a wide spread might indicate less interest. Understanding these components helps you make informed decisions in day trading.
How do I read options chain data effectively?
To read options chain data effectively for day trading, focus on these key elements:
1. Strike Prices: Identify the strike prices relevant to the underlying asset's current price. Look for those closest to the market price for higher activity.
2. Expiration Dates: Check the expiration dates. Shorter-term options are more volatile and suitable for day trading.
3. Volume and Open Interest: Look at the volume to gauge current trading activity and open interest to understand the number of outstanding contracts. High values indicate liquidity.
4. Bid-Ask Spread: Analyze the bid-ask spread. A tighter spread suggests better entry and exit points, crucial for day trading.
5. Implied Volatility: Monitor implied volatility. Higher volatility can increase premiums, affecting your potential profit and risk.
6. Greeks: Pay attention to the Greeks, especially Delta and Gamma, to assess how options prices will move in relation to the underlying asset.
7. Market Sentiment: Look for unusual options activity or large trades that might indicate market sentiment shifts.
By focusing on these elements, you can make informed decisions while reading options chains for day trading.
What key components are in an options chain?
An options chain includes key components like the expiration date, strike price, option type (call or put), bid price, ask price, last price, volume, and open interest. These elements help traders assess market sentiment and make informed decisions for day trading.
How do bid and ask prices work in options chains?
Bid and ask prices in options chains represent the buying and selling prices for options contracts. The bid price is the highest price a buyer is willing to pay for an option, while the ask price is the lowest price a seller will accept.
When you look at an options chain, the difference between these two prices is called the spread. A narrower spread often indicates higher liquidity, making it easier to enter and exit trades. Day traders should pay attention to this spread, as it impacts potential profits. For example, if you buy an option at the ask price and sell it at the bid price, your profit will be reduced by the spread.
Understanding these prices helps day traders make informed decisions about entry and exit points in their trades.
What do open interest and volume indicate in options chains?

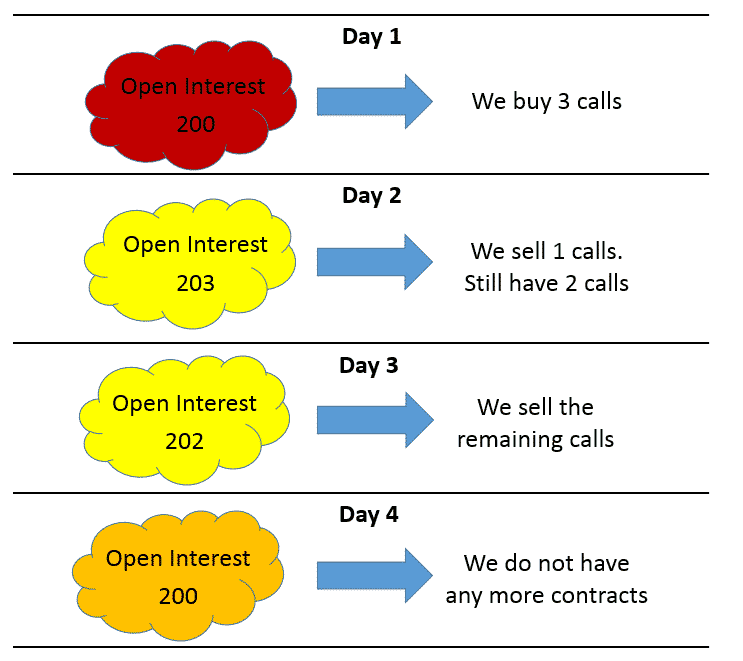
Open interest indicates the total number of outstanding options contracts that have not been settled. High open interest suggests liquidity and interest in a particular strike price, while low open interest may indicate less activity.
Volume reflects the number of options contracts traded during a specific period. High volume signals strong interest and can lead to price movement, while low volume may indicate weaker sentiment.
Together, open interest and volume help day traders gauge market activity and potential price direction in options trading.
How can I identify bullish or bearish signals in options chains?
To identify bullish or bearish signals in options chains, look for these key indicators:
1. Open Interest: High open interest in calls suggests bullish sentiment, while high open interest in puts indicates bearish sentiment.
2. Volume: Increased volume in calls compared to puts signals bullish interest. Conversely, high put volume may suggest bearish activity.
3. Implied Volatility (IV): Rising IV in calls can indicate bullish sentiment, while increasing IV in puts may suggest bearish expectations.
4. Bid-Ask Spread: Narrow spreads often indicate strong interest; a narrower spread in calls suggests bullish activity, while in puts, it may indicate bearish sentiment.
5. Strike Price Activity: Look for significant activity at specific strike prices. Heavy call buying at a strike can signal bullishness, while heavy put buying can suggest bearishness.
6. Unusual Options Activity: Monitor for large trades that deviate from the norm, which may indicate strong directional moves.
Utilize these indicators to gauge market sentiment effectively.
What are strike prices and how do they affect options trading?
Strike prices are the predetermined levels at which an options contract can be exercised. In options trading, they play a crucial role in determining potential profit and loss. When reading options chains, the strike price helps you identify the cost of buying or selling the underlying asset.
For call options, a lower strike price generally increases the likelihood of profitability if the asset's price rises. For put options, a higher strike price offers better profit potential if the asset's price falls. Understanding how to choose the right strike price based on market conditions and your trading strategy is essential for successful day trading.
How do expiration dates influence options chains?
Expiration dates are crucial in options chains as they determine the lifespan of an option contract. Options close to expiration exhibit increased time decay, which can significantly affect their price. Traders often focus on short-term options to capitalize on rapid price movements, while longer-dated options may offer more stability but less immediate profit potential. As expiration approaches, implied volatility can rise or fall, impacting option premiums. Understanding these dynamics helps day traders make informed decisions on which options to buy or sell.
What is the significance of implied volatility in options chains?

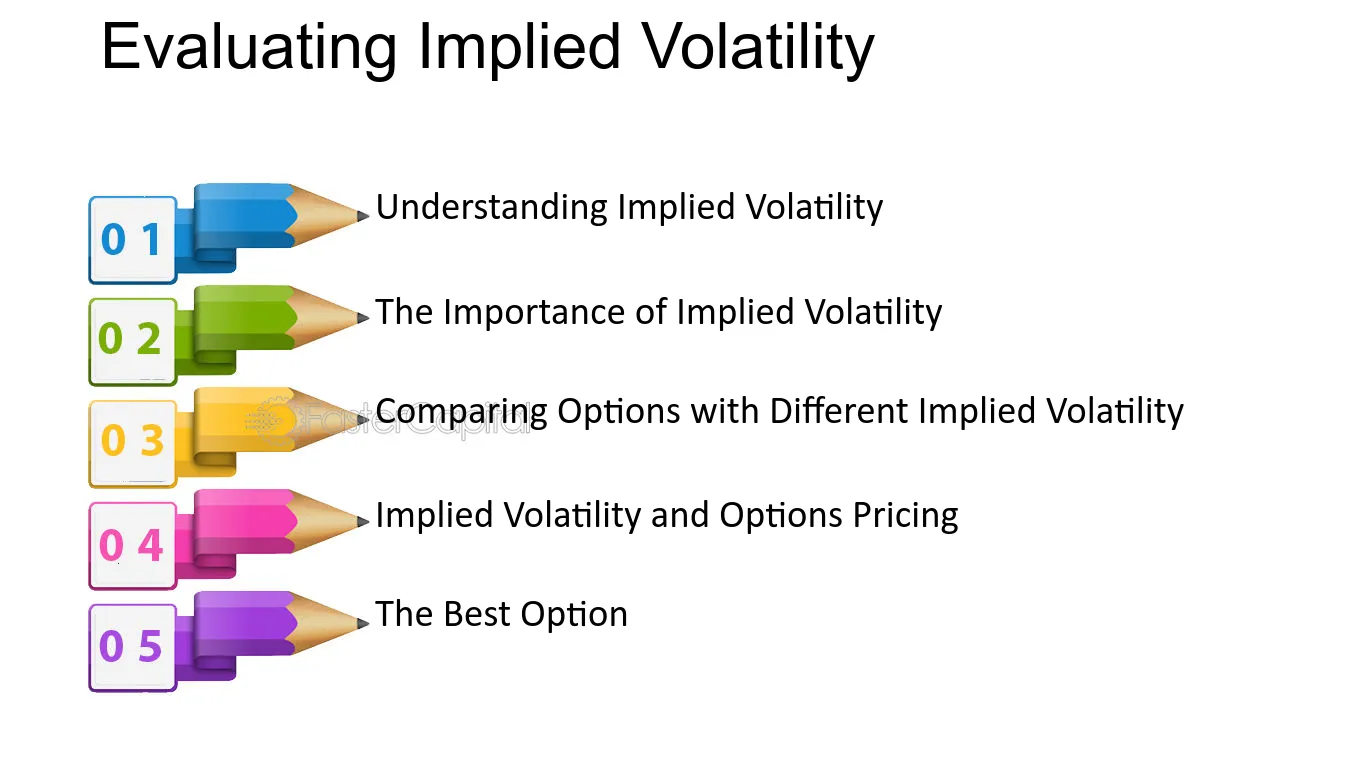
Implied volatility (IV) indicates the market's expectations for future price movements of the underlying asset. In options chains, higher IV suggests that traders anticipate significant price swings, which can lead to higher options premiums. For day trading, monitoring IV helps you assess potential profit opportunities and risks. Low IV might mean less movement, making options less attractive for quick trades. Understanding IV can guide your decisions on which options to buy or sell based on market sentiment.
How can I use the Greeks to analyze options chains?
Use the Greeks—Delta, Gamma, Theta, Vega, and Rho—to analyze options chains effectively.
1. Delta: Understand how much an option's price will move with a $1 change in the underlying asset. A high Delta indicates a strong correlation, crucial for day trading.
2. Gamma: Assess the rate of change in Delta. High Gamma suggests that Delta could change rapidly, impacting your options strategy.
3. Theta: Monitor time decay. Options lose value as expiration approaches. A high Theta means you need to be cautious about holding options too long.
4. Vega: Evaluate the sensitivity to volatility. If you expect increased volatility, look for options with high Vega to maximize potential gains.
5. Rho: Consider interest rate sensitivity. While less impactful for day trading, it’s useful for understanding long-term positions.
By analyzing these Greeks, you can make informed decisions on which options to trade, set realistic profit targets, and manage risk effectively.
What tools can help me read options chains more efficiently?
To read options chains more efficiently for day trading, use these tools:
1. Brokerage Platforms: Most online brokers, like TD Ameritrade or E*TRADE, offer advanced options chains with filtering tools.
2. Options Analysis Software: Tools like ThinkOrSwim or Option Samurai provide in-depth analytics and visualizations.
3. Mobile Apps: Apps like Robinhood or Webull allow quick access to options chains on the go.
4. Market Scanners: Use scanners like Trade-Ideas to identify high-volume options and unusual activity.
5. Options Trading Calculators: Tools like the Options Profit Calculator help assess potential trades quickly.
Integrating these tools can streamline your options trading process.
How Can You Effectively Read Options Chains for Day Trading?
To read options chains for day trading, identify the underlying asset and choose the expiration date. Focus on the strike prices, noting the bid and ask prices, volume, and open interest. Pay attention to the implied volatility and delta for insights on price movement. Use this data to assess potential trades and manage risk effectively.
Learn more about: Understanding Options in Day Trading
How do I interpret an options chain for a specific stock?
To interpret an options chain for a specific stock, start by identifying the expiration dates listed. Each row represents a different strike price and the corresponding call and put options. Look for the following key components:
1. Strike Price: This is the price at which you can buy (call) or sell (put) the stock.
2. Bid and Ask Prices: The bid is what buyers are willing to pay, and the ask is what sellers want. The difference is the spread.
3. Volume: This shows how many contracts have traded during the day. High volume indicates interest and liquidity.
4. Open Interest: This reflects the total number of outstanding contracts. Higher open interest can signal stronger market sentiment.
5. Implied Volatility (IV): This indicates market expectations for future volatility. Higher IV typically increases option premiums.
Analyze these elements together to gauge market sentiment and potential price movements. For day trading, focus on short-term options with high volume and low spreads for better execution.
What are the common mistakes to avoid when reading options chains?
1. Ignoring the Bid-Ask Spread: Always check the bid-ask spread; a wide spread can indicate low liquidity.
2. Overlooking Expiration Dates: Focus on the expiration dates that align with your trading strategy to avoid unexpected outcomes.
3. Misinterpreting Open Interest: High open interest doesn't always mean good liquidity; analyze it alongside volume.
4. Neglecting Implied Volatility: Understand implied volatility; it affects option pricing and your potential profits or losses.
5. Failing to Assess Delta: Delta gives insight into how much an option's price might move with the underlying asset; don't skip this.
6. Not Considering Market Conditions: Be aware of market conditions that can influence option pricing, like earnings reports or economic data releases.
7. Relying Solely on Technical Indicators: Combine technical analysis with options chain data for a comprehensive view.
8. Ignoring Assignment Risk: Be aware of the risks of being assigned, especially with short options positions.
Avoid these mistakes to improve your options trading strategy.
How can I use options chains for risk management in day trading?

To use options chains for risk management in day trading, start by analyzing the implied volatility and open interest of the options. Choose options with high liquidity to ensure better execution. Look at the bid-ask spread; narrower spreads indicate lower costs.
Identify key support and resistance levels from the options chain. Use this data to set stop-loss orders on your trades. You can also implement strategies like buying protective puts to hedge against potential losses. Monitor the delta of options to gauge how much they might move with the underlying stock, helping you adjust your positions accordingly.
Finally, regularly review the options chain for changes that could impact your trades, like earnings announcements or market events. This proactive approach will enhance your risk management in day trading.
Learn about How to Use Technical Analysis for Options Day Trading
What strategies can I employ using options chains?
To effectively use options chains for day trading, focus on these strategies:
1. Identify Liquid Options: Look for options with high open interest and volume to ensure tight spreads and better execution.
2. Analyze Implied Volatility: Use implied volatility to gauge market expectations. High IV may indicate potential price swings, while low IV suggests stability.
3. Use the Greeks: Familiarize yourself with Delta, Gamma, Theta, and Vega to understand how options might react to price changes in the underlying asset.
4. Look for Unusual Activity: Spot significant increases in volume or open interest, which can signal potential price movements.
5. Select Expiration Dates Wisely: For day trading, consider options with shorter expiration dates to capitalize on quick movements.
6. Set Clear Targets: Define entry and exit points based on your analysis to manage risk and lock in profits.
7. Employ Spreads: Use strategies like vertical spreads to limit risk while still taking advantage of price movements.
8. Monitor Market Sentiment: Pay attention to news and events that could impact the underlying stock to make informed decisions.
By applying these strategies, you can read options chains effectively and enhance your day trading approach.
How do I practice reading options chains before real trading?
To practice reading options chains before real trading, start by using a stock market simulator that offers options trading. Familiarize yourself with key components of the options chain, like strike prices, expiration dates, and volume. Analyze different options strategies by selecting a stock and observing how changes in the underlying asset affect option prices. Use online resources or trading platforms to access real-time data and practice interpreting bid/ask spreads, implied volatility, and open interest. Set up hypothetical trades based on your analysis and track their performance to build confidence and understanding.
Conclusion about How to Read Options Chains for Day Trading
In summary, mastering the art of reading options chains is crucial for successful day trading. By understanding key components like bid and ask prices, open interest, and implied volatility, traders can make informed decisions. Utilizing tools and strategies effectively enhances your ability to interpret options data, providing a competitive edge. To further refine your skills, practice regularly and stay aware of common pitfalls. Embracing these practices will not only improve your trading performance but also equip you with the knowledge necessary for effective risk management. For more in-depth insights and guidance, DayTradingBusiness is here to support your journey.
Learn about Frequently Asked Questions About Day Trading Options