Did you know that some traders spend more time analyzing stock charts than they do on their love lives? If only those charts came with a “date night” feature! In this article, we’ll break down the essential elements of stock chart evaluation for day trading decisions, covering key indicators, trend identification, volume patterns, and candlestick formations. You'll learn about the importance of support and resistance levels, how moving averages can enhance your analysis, and the significance of various chart patterns. Plus, we'll dive into how news events impact your trading strategy and the benefits of backtesting. By the end, you’ll be equipped with the knowledge to avoid common pitfalls and effectively combine indicators, ultimately helping you make informed trading decisions. Let DayTradingBusiness guide you through the nuances of stock chart analysis, so you can trade smarter, not harder.
What are the key elements to look for in stock charts for day trading?
Key elements to look for in stock charts for day trading include:
1. Volume: High trading volume indicates strong interest and can confirm price movements.
2. Price Patterns: Look for formations like triangles, flags, or head and shoulders that suggest potential trends.
3. Moving Averages: Use short-term moving averages (like the 5 or 10-day) to identify trends and potential entry or exit points.
4. Support and Resistance Levels: Identify these levels to gauge potential reversal points or breakout areas.
5. Candlestick Patterns: Recognize patterns like doji, hammer, or engulfing to forecast price movements.
6. Relative Strength Index (RSI): An RSI above 70 may indicate overbought conditions, while below 30 may suggest oversold conditions.
7. Chart Timeframes: Utilize multiple timeframes (like 1-minute and 5-minute charts) for a comprehensive view of price action.
Focus on these elements to make informed day trading decisions.
How can I identify trends in stock charts for effective day trading?
To identify trends in stock charts for effective day trading, focus on these key steps:
1. Use Moving Averages: Apply short-term moving averages (like the 5-day and 20-day) to spot trends. A price crossing above a moving average indicates upward momentum; below suggests downward.
2. Look for Patterns: Identify common chart patterns such as flags, triangles, and head-and-shoulders. These can signal potential price movements.
3. Analyze Volume: High trading volume during price increases suggests a strong trend. Conversely, low volume can indicate weakness.
4. Check Trend Lines: Draw trend lines connecting swing highs and lows. Breakouts above resistance or below support can signal entry or exit points.
5. Use Technical Indicators: Incorporate indicators like RSI or MACD. An RSI above 70 indicates overbought conditions; below 30 indicates oversold.
6. Monitor News and Events: Be aware of market news that can influence stock prices, as this can create sudden trends.
By combining these methods, you can effectively identify trends and make informed day trading decisions.
What indicators should I use when analyzing stock charts?
When analyzing stock charts for day trading, use these key indicators:
1. Moving Averages: Helps identify trends; the 50-day and 200-day are popular.
2. Relative Strength Index (RSI): Measures momentum; values above 70 indicate overbought, below 30 oversold.
3. MACD (Moving Average Convergence Divergence): Shows trend changes and momentum; look for crossovers.
4. Bollinger Bands: Indicates volatility; price touching the bands can signal potential reversals.
5. Volume: Confirms trend strength; higher volume on price moves indicates stronger conviction.
6. Fibonacci Retracement Levels: Identifies potential reversal levels based on past price movements.
Combine these indicators for more effective decision-making in day trading.
How do volume patterns influence day trading decisions?
Volume patterns play a crucial role in day trading decisions. High volume often indicates strong interest in a stock, confirming the validity of a price movement. Traders look for spikes in volume to identify potential breakouts or reversals. For instance, if a stock surges in price with increased volume, it suggests momentum, making it a candidate for buying. Conversely, low volume during a price increase can signal weakness, prompting traders to avoid that stock. Analyzing volume trends alongside price movements helps traders make informed decisions, increasing the chances of successful trades.
What role do candlestick patterns play in day trading?

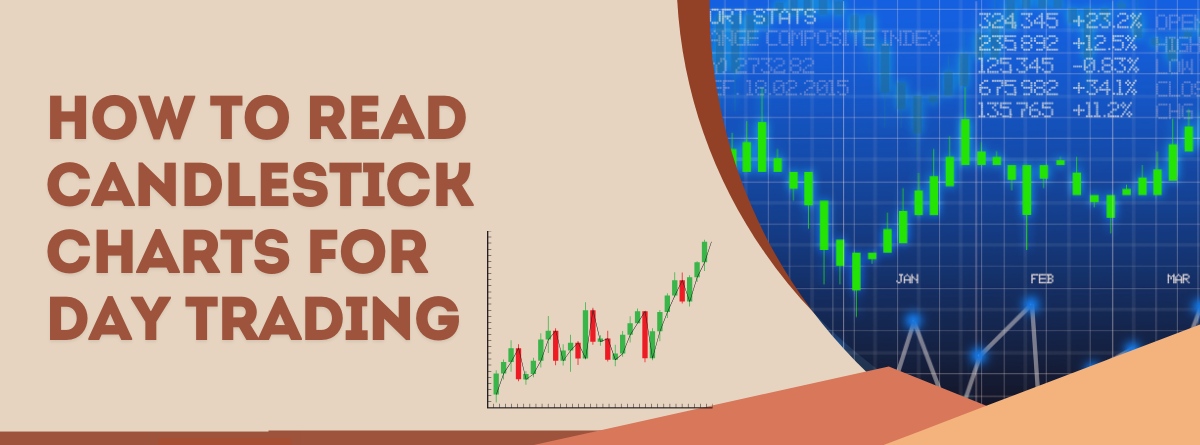
Candlestick patterns are crucial in day trading as they help traders identify potential price movements and reversals. Patterns like dojis, hammers, and engulfing candles indicate market sentiment and can signal entry or exit points. By analyzing these formations alongside volume and trends, traders make informed decisions quickly. Recognizing these patterns enhances the ability to predict short-term price actions, which is essential for successful day trading strategies.
How can moving averages improve my stock chart analysis?
Moving averages smooth out price data, helping to identify trends in stock charts. They filter out noise, making it easier to spot the overall direction of a stock. Short-term moving averages can signal potential entry or exit points for day trading, while long-term averages provide insight into overall market trends. Using moving averages in conjunction with other indicators enhances decision-making and can improve trade timing.
What are support and resistance levels, and why are they important?
Support levels are price points where a stock tends to stop falling and may bounce back up, indicating buying interest. Resistance levels are where a stock usually stops rising and may reverse down, showing selling pressure.
These levels are crucial in day trading because they help traders identify potential entry and exit points. By recognizing support, traders can buy with confidence, anticipating a price increase. Similarly, knowing resistance allows traders to sell or short, expecting a price drop. Understanding these levels enhances decision-making, risk management, and overall trading strategy.
How do I use stock chart timeframes to make better trades?
To use stock chart timeframes effectively for day trading, focus on these steps:
1. Choose Your Timeframe: Start with a 1-minute or 5-minute chart for quick trades. Use 15-minute or 30-minute charts for more strategic decisions.
2. Identify Trends: Look for trends across multiple timeframes. If the 1-minute chart shows an uptrend, confirm it on the 5-minute and 15-minute charts for stronger signals.
3. Support and Resistance: Analyze support and resistance levels on higher timeframes (like hourly or daily) to set entry and exit points.
4. Volume Analysis: Check volume alongside price movements. Increased volume on a breakout can confirm a potential trade.
5. Use Indicators: Apply moving averages or RSI to different timeframes to gauge momentum and potential reversals.
6. Time Your Trades: Execute trades during high volatility periods, like market open or close, when price movements are more pronounced.
By synchronizing your strategy across various timeframes, you can enhance your decision-making and improve your trading outcomes.
How Can I Evaluate Stock Charts to Identify the Best Stocks for Day Trading Today?
Best stocks for day trading today include high-volume stocks with volatility. Look for stocks like Tesla (TSLA), Amazon (AMZN), and Apple (AAPL) that show significant price movement. Evaluate stock charts for day trading decisions by analyzing support and resistance levels, moving averages, and RSI indicators. Focus on stocks with news catalysts and strong liquidity for optimal trading opportunities.
Learn more about: Best Stocks for Day Trading Today
What common mistakes should I avoid when evaluating stock charts?

When evaluating stock charts for day trading, avoid these common mistakes:
1. Ignoring volume: Always consider trading volume; it confirms price movements.
2. Overlooking trends: Focus on the overall trend rather than short-term fluctuations.
3. Relying solely on indicators: Use a combination of indicators and price action for better insight.
4. Neglecting support and resistance: Identify key levels to avoid entering at unfavorable prices.
5. Failing to set stop-loss orders: Protect your capital by always having a stop-loss strategy in place.
6. Misinterpreting patterns: Ensure you understand chart patterns before making decisions.
7. Overtrading: Avoid making too many trades based on impulsive decisions; be selective and strategic.
How can I effectively combine multiple indicators on stock charts?
To effectively combine multiple indicators on stock charts for day trading, start by selecting a mix of trend and momentum indicators. For example, use moving averages (like the 50-day and 200-day) to identify overall trends, and pair them with the Relative Strength Index (RSI) to gauge momentum.
Next, look for confluence. If a stock is above its moving average and the RSI is above 70, it might indicate overbought conditions, suggesting a potential reversal. Conversely, if the price is below the moving average and the RSI is below 30, it could signal oversold conditions.
Consider volume indicators as well. A price movement supported by high volume is more reliable. Use tools like the Moving Average Convergence Divergence (MACD) alongside your chosen indicators to spot momentum shifts.
Finally, always backtest your combinations to see how they perform historically. Adjust based on your findings for optimal results in your day trading strategy.
What is the significance of chart patterns like head and shoulders?
Head and shoulders patterns are significant in day trading because they signal potential trend reversals. The pattern consists of three peaks: a higher peak (the head) flanked by two lower peaks (the shoulders). When identified, it suggests a shift from bullish to bearish sentiment. Traders often use it to inform entry and exit points, enhancing their decision-making process. Recognizing this pattern can help in predicting price movements, thereby optimizing trading strategies and risk management.
How do I interpret charting tools like Bollinger Bands?

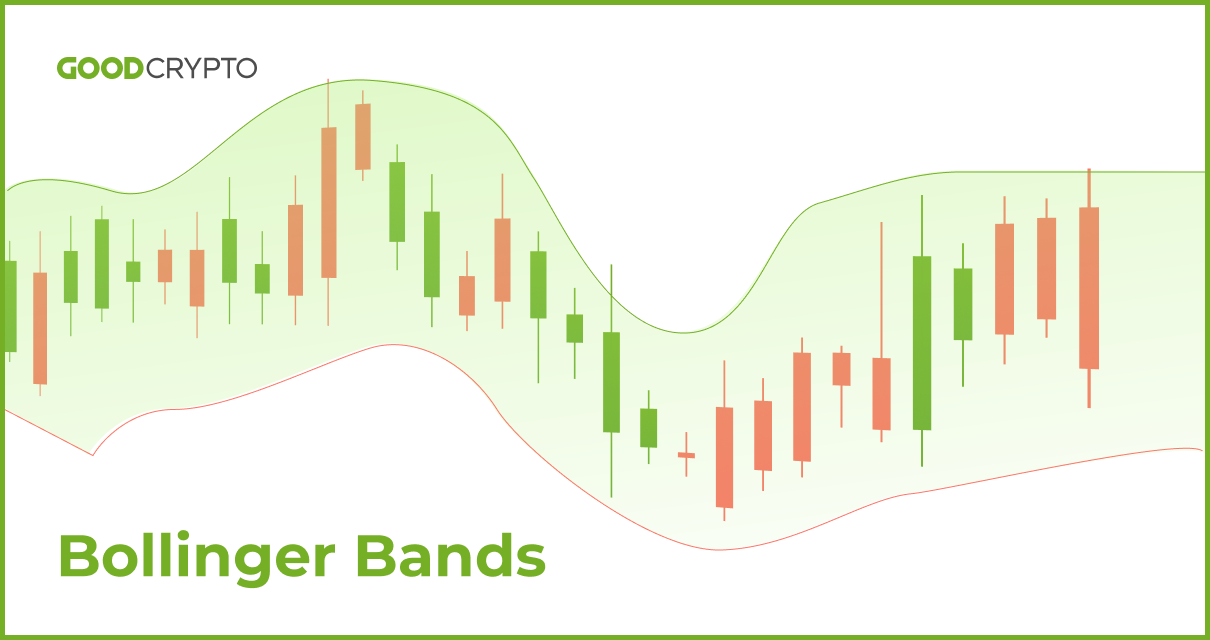
To interpret Bollinger Bands, look at the three lines: the middle band is the simple moving average (SMA), while the upper and lower bands represent standard deviations from that average. When the price touches the upper band, it may indicate overbought conditions; conversely, touching the lower band can signal oversold conditions.
A squeeze, where the bands come close together, suggests low volatility and potential for a price breakout. Focus on the price movement relative to the bands to make day trading decisions: consider buying when the price bounces off the lower band and selling when it hits the upper band. Use volume alongside Bollinger Bands for confirmation.
What is the impact of news events on stock chart analysis?
News events can significantly influence stock chart analysis by causing abrupt price movements, changing trading volume, and altering market sentiment. Positive news can lead to bullish trends, reflecting increased buying pressure, while negative news often results in bearish patterns, with selling pressure dominating. Traders must watch for spikes in volume on charts following news releases, as this indicates strong market reactions. Additionally, chart patterns may break down or break out in response to news, making it crucial for day traders to integrate news analysis with technical indicators for informed decision-making.
How can backtesting strategies enhance my day trading success?
Backtesting strategies can significantly enhance your day trading success by allowing you to evaluate stock charts against historical data. This process helps you identify which strategies have worked in the past and can potentially work again. By analyzing performance metrics like win rate and average return, you can refine your trading approach and minimize risks. Additionally, backtesting reveals market patterns and signals that you can exploit, improving your decision-making. Overall, it builds confidence in your strategy, enabling you to trade more effectively.
Learn about How to Backtest Futures Day Trading Strategies
What resources can help me learn more about stock chart analysis?
To learn about stock chart analysis for day trading, consider these resources:
1. Books: "Technical Analysis of the Financial Markets" by John Murphy and "A Beginner's Guide to Forex Trading" by Matthew Driver provide solid foundations.
2. Online Courses: Platforms like Udemy and Coursera offer courses focused on stock charting and technical analysis.
3. YouTube Channels: Channels like Rayner Teo and The Trading Channel provide practical tutorials and analysis.
4. Trading Software: Use tools like TradingView or ThinkorSwim for hands-on practice with real-time charts.
5. Forums and Communities: Engage with communities on Reddit (like r/Daytrading) or StockTwits to exchange insights and strategies.
6. Webinars: Many brokers and trading educators host free webinars on chart analysis techniques.
These resources will enhance your understanding of stock charts and improve your day trading decisions.
How do I adapt my stock chart evaluation for different market conditions?
To adapt your stock chart evaluation for different market conditions, first identify the trend: bullish, bearish, or sideways. In a bullish market, focus on breakout patterns and support levels. Look for higher highs and higher lows. In a bearish market, prioritize resistance levels and reversal patterns, watching for lower highs and lower lows. For sideways markets, use horizontal support and resistance zones to identify potential breakouts or breakdowns. Adjust your indicators accordingly; for instance, use moving averages to confirm trends and RSI to spot overbought or oversold conditions. Tailor your risk management strategies to the volatility of the market as well.
Conclusion about Evaluating Stock Charts for Day Trading Decisions
In conclusion, mastering stock chart evaluation is crucial for successful day trading. By focusing on key elements like trends, volume patterns, and indicators, traders can make informed decisions. Understanding support and resistance levels, along with the significance of candlestick patterns, enhances your strategy. Tools such as moving averages and Bollinger Bands further refine analysis, while backtesting strategies solidify your approach. For those looking to deepen their knowledge, resources and guidance from experts like DayTradingBusiness can provide invaluable support in navigating the complexities of stock chart analysis.