Did you know that the average day trader spends more time analyzing charts than a chef spends deciding on dinner? In the fast-paced world of day trading, understanding key metrics is crucial for success. This article dives into essential metrics like stock volatility, trading volume, and the average true range (ATR), all vital for making informed decisions. We also cover the significance of the bid-ask spread, the role of moving averages, and key performance indicators (KPIs) that can enhance your trading strategy. Learn how to effectively analyze price action, assess risk-reward ratios, and use stop-loss orders to safeguard your investments. Additionally, we’ll discuss the impact of market news and common pitfalls to avoid. With insights from DayTradingBusiness, you’ll be well-equipped to navigate the complexities of day trading and identify the best stocks based on these critical metrics.
What are the most important metrics for day trading stocks?
The most important metrics for day trading stocks include:
1. Volume: Indicates how many shares are traded, helping assess liquidity.
2. Volatility: Measures price fluctuations, essential for identifying trading opportunities.
3. Price Action: Analyzes stock price movement to inform buy/sell decisions.
4. Bid-Ask Spread: The difference between buying and selling prices, crucial for determining trade costs.
5. Moving Averages: Helps identify trends by smoothing out price data over specific periods.
6. Relative Strength Index (RSI): Gauges momentum and whether a stock is overbought or oversold.
7. Average True Range (ATR): Measures market volatility, aiding in position sizing.
Focusing on these metrics can enhance your day trading strategy.
How do I measure stock volatility for day trading?
To measure stock volatility for day trading, focus on these key metrics:
1. Average True Range (ATR): This indicator shows the average range of price movement over a specific period, helping you gauge volatility.
2. Beta: This measures a stock's volatility compared to the market. A beta greater than 1 indicates higher volatility.
3. Standard Deviation: Calculate the standard deviation of a stock's price over a set timeframe. A higher standard deviation means greater volatility.
4. Historical Volatility: Assess the percentage change in price over a certain period to understand past price fluctuations.
5. Volume: High trading volume often indicates greater volatility, as it shows increased interest and price movement.
Use these metrics to identify stocks that fit your volatility trading strategy.
What role does trading volume play in day trading metrics?
Trading volume is crucial in day trading metrics as it indicates the level of activity and liquidity in a stock. Higher volume often signifies stronger interest and can lead to more accurate price movements, enabling traders to enter and exit positions more effectively. It also helps confirm trends; for instance, a price increase on high volume suggests a strong bullish sentiment. Conversely, low volume can signal potential reversals or weak trends, making it riskier to trade. In summary, trading volume is a key indicator of market strength and reliability in day trading strategies.
How can I use the average true range (ATR) for day trading?
Use the Average True Range (ATR) to assess market volatility and set your stop-loss and take-profit levels. A higher ATR indicates greater volatility, suggesting you might need wider stops. For entry points, look for price movements that exceed a certain multiple of the ATR, signaling potential breakout opportunities. Incorporate ATR into your risk management by adjusting position sizes based on its value—larger ATR means smaller position sizes to maintain consistent risk. Regularly monitor ATR to adapt your strategy as market conditions change.
What is the significance of the bid-ask spread in day trading?
The bid-ask spread is crucial in day trading because it indicates the liquidity of a stock and the cost of entering and exiting trades. A narrow spread means lower transaction costs, allowing traders to profit more easily. Conversely, a wide spread can eat into profits and signal lower liquidity, making it riskier to trade. Understanding the spread helps traders make informed decisions about timing and stock selection.
How do moving averages affect day trading decisions?
Moving averages help day traders identify trends and potential entry or exit points. A short-term moving average crossing above a long-term moving average signals a buying opportunity, while a crossover in the opposite direction suggests selling. Traders often use the 50-day and 200-day moving averages to gauge momentum. Additionally, moving averages can act as support or resistance levels during price fluctuations, guiding stop-loss placements. Overall, they provide clarity in fast-moving markets, enhancing decision-making.
What are key performance indicators (KPIs) for day traders?
Key performance indicators (KPIs) for day traders include:
1. Win Rate: Percentage of profitable trades versus total trades. A higher win rate indicates better trading decisions.
2. Average Gain/Loss: Measure the average profit on winning trades and the average loss on losing trades. This helps assess risk-reward balance.
3. Risk-Reward Ratio: The ratio of potential profit to potential loss. A common target is 2:1 or higher.
4. Trade Frequency: Number of trades executed within a specific period. This reflects activity level and can impact overall profitability.
5. Profit Factor: Total gross profit divided by total gross loss. A profit factor above 1 indicates that gains outweigh losses.
6. Sharpe Ratio: Measures risk-adjusted return. A higher Sharpe ratio signifies better returns per unit of risk taken.
7. Maximum Drawdown: The largest drop from a peak to a trough in your trading account. This assesses risk exposure and potential loss magnitude.
8. Commission Costs: Total trading fees can eat into profits. Monitoring these helps evaluate the net profitability of your strategy.
These KPIs provide insights into trading performance, risk management, and strategy effectiveness.
How can I analyze price action for day trading effectiveness?

To analyze price action for day trading effectiveness, focus on these key metrics:
1. Volume: Look for high volume on price movements; it indicates strong interest and can validate trends.
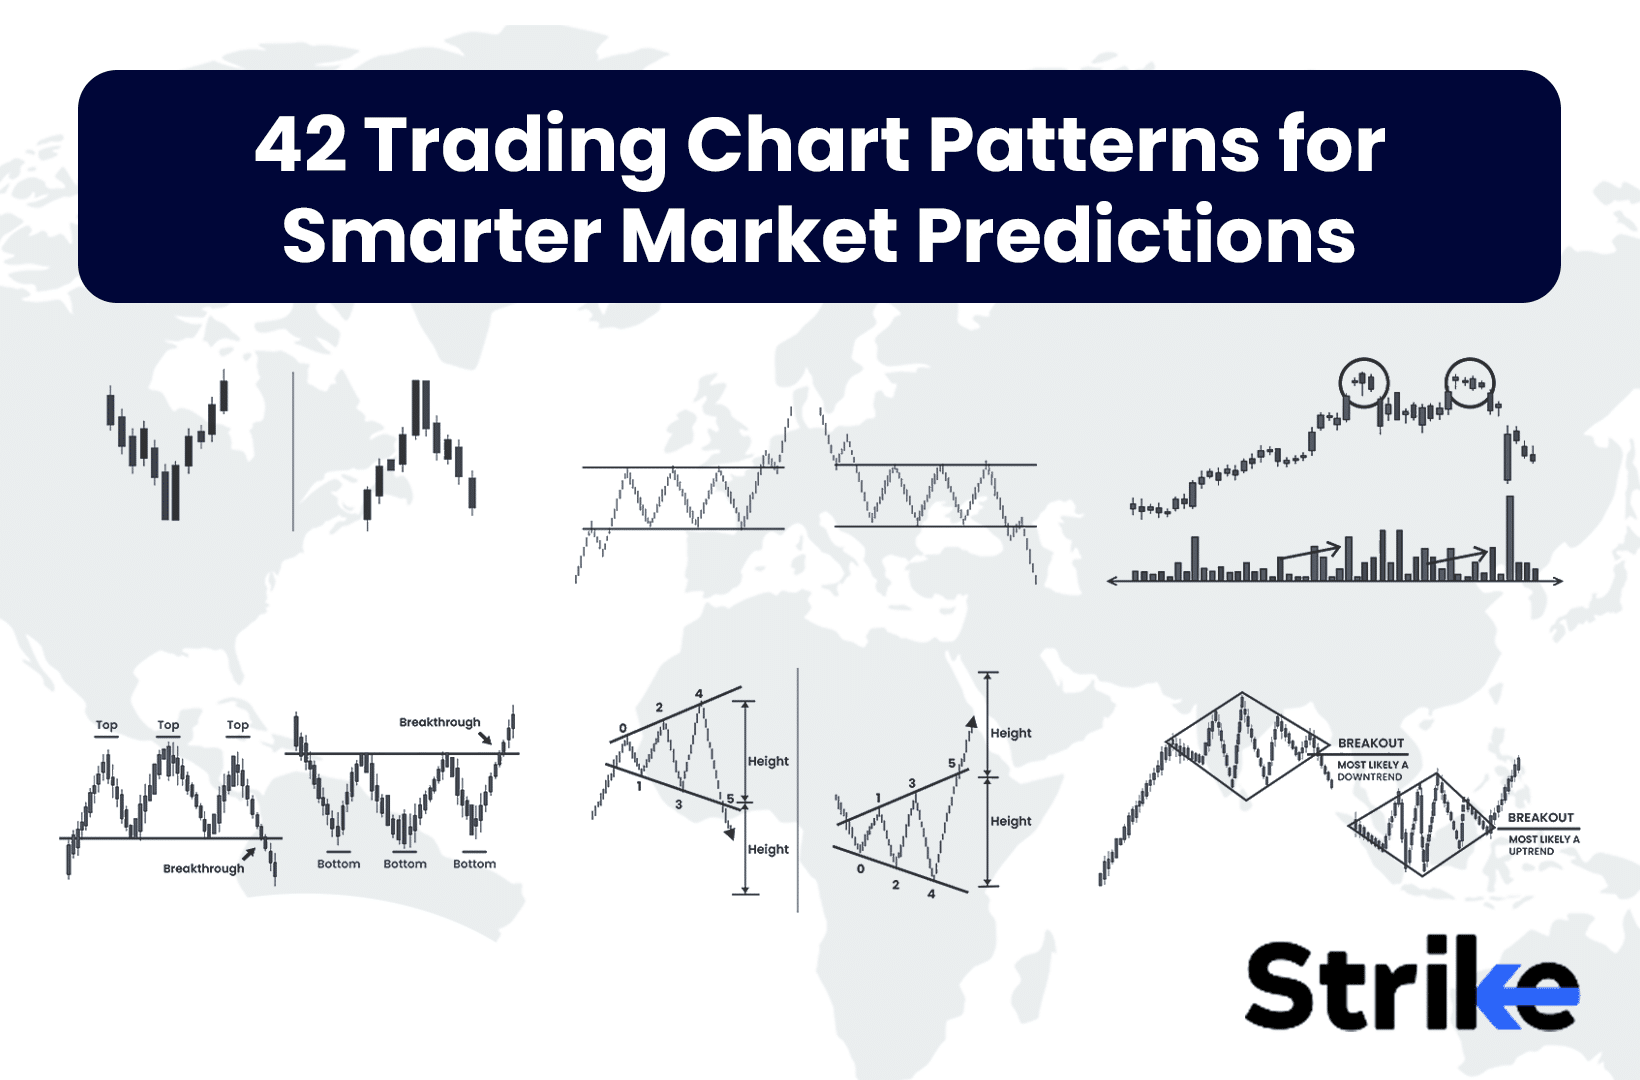
2. Price Patterns: Identify patterns like flags, triangles, or head and shoulders to predict potential reversals or continuations.
3. Support and Resistance Levels: Determine these levels to spot where price may reverse or break out.
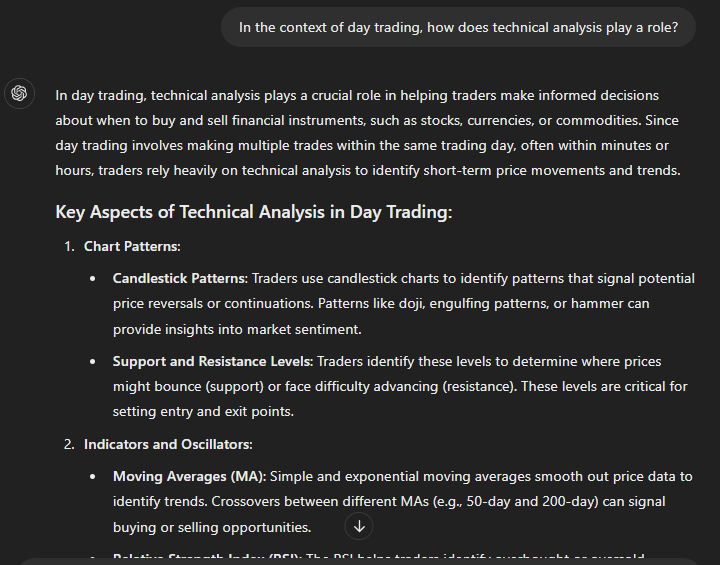
4. Candlestick Analysis: Use candlestick patterns to gauge market sentiment and potential price direction.
5. Moving Averages: Monitor short-term moving averages (like the 10 or 20-day) to identify trends and entry points.
6. Volatility: Assess volatility through indicators like the Average True Range (ATR) to understand potential price swings.
7. Time Frames: Analyze multiple time frames (like 1-minute, 5-minute, and 15-minute charts) for a comprehensive view of price action.
Using these metrics will enhance your day trading strategy and improve decision-making.
What is the importance of risk-reward ratio in day trading?
The risk-reward ratio in day trading is crucial because it helps traders evaluate potential profits against potential losses. A favorable ratio, like 1:3, means for every dollar risked, you aim to make three. This guides decision-making, ensuring you only take trades with a higher probability of success. It also aids in managing capital effectively, minimizing losses while maximizing gains. Understanding this ratio can lead to more disciplined trading and better overall performance.
How do I calculate and interpret key stock indicators?
To calculate key stock indicators for day trading, focus on these metrics:
1. Price-to-Earnings (P/E) Ratio: Divide the stock's current price by its earnings per share (EPS). A lower P/E may indicate undervaluation.
2. Moving Averages (MA): Calculate the average stock price over a specific period, like 50 or 200 days. Use it to identify trends; a price above the MA suggests an uptrend.
3. Relative Strength Index (RSI): Use the formula RSI = 100 – (100 / (1 + RS)). An RSI above 70 indicates overbought conditions, while below 30 suggests oversold.
4. Volume: Track the number of shares traded. Higher volume often confirms a price move’s strength.
5. Bollinger Bands: Calculate the standard deviation around a moving average. Prices near the upper band may signal a sell, while those near the lower band indicate a buy.
Interpret these indicators by looking for trends, potential buy and sell signals, and market sentiment. Use them together for a more comprehensive view of stock performance.
What metrics help identify trending stocks for day trading?

Key metrics for identifying trending stocks in day trading include:
1. Volume: High trading volume indicates strong interest and can suggest potential price movements.
2. Price Action: Look for stocks with significant price changes, especially those making new highs or lows.
3. Volatility: Stocks with higher volatility can offer better opportunities for profit within a single day.
4. Moving Averages: Use short-term moving averages (like the 5-day and 20-day) to spot trends.
5. Relative Strength Index (RSI): An RSI above 70 may indicate overbought conditions, while below 30 can suggest oversold conditions.
6. News Catalysts: Stocks with recent news or earnings reports often see increased activity and can trend significantly.
Focus on these metrics to effectively spot and capitalize on trending stocks for day trading.
## What Are the Best Stocks for Day Trading Today Based on Key Metrics?
Key metrics for day trading stocks include:
1. **Volume**: High trading volume indicates liquidity.
2. **Volatility**: Look for stocks with significant price movements.
3. **Price Action**: Analyze historical price patterns for trends.
4. **Market Capitalization**: Focus on mid to large-cap stocks for stability.
5. **News Catalysts**: Monitor upcoming earnings or events that could impact stock price.
These metrics help identify the best stocks for day trading today.
Learn more about: Best Stocks for Day Trading Today
Learn about Best Stocks for Day Trading Today
How can I use stop-loss orders as a metric in day trading?
Use stop-loss orders to limit potential losses in day trading by setting a predetermined exit point for your trades. Determine your risk tolerance and set the stop-loss at a specific percentage below your entry price. This helps protect your capital and ensures you stick to your trading plan. Monitor the stock's volatility to adjust your stop-loss accordingly. Incorporating stop-loss orders into your strategy enhances risk management and can improve overall profitability.
What are the best technical indicators for day trading stocks?
The best technical indicators for day trading stocks include:
1. Moving Averages: Use the 50-day and 200-day moving averages to identify trends.
2. Relative Strength Index (RSI): Indicates overbought or oversold conditions, helping to spot reversals.
3. Bollinger Bands: Shows volatility and potential price breakouts.
4. MACD (Moving Average Convergence Divergence): Helps identify momentum shifts and trend reversals.
5. Volume: Confirms price movements; higher volume often signals stronger trends.
6. Stochastic Oscillator: Assists in identifying overbought or oversold levels.
Combine these indicators for a more effective day trading strategy.
Learn about Leveraging Technical Indicators for Day Trading Stocks
How do I evaluate my day trading performance metrics?
To evaluate your day trading performance metrics, focus on these key areas:
1. Win Rate: Calculate the percentage of profitable trades versus total trades. A higher win rate indicates effective strategies.
2. Risk-Reward Ratio: Analyze the average profit of winning trades compared to the average loss of losing trades. Aim for a ratio of at least 2:1.
3. Average Trade Duration: Track how long you hold positions. Shorter durations can indicate effective scalping or quick decision-making.
4. Profit Factor: Divide total profits by total losses. A profit factor above 1.5 suggests good performance.
5. Drawdown: Measure the peak-to-trough decline in your trading account. Minimize drawdowns to maintain capital and confidence.
6. Sharpe Ratio: Assess risk-adjusted returns by comparing excess return to volatility. A higher Sharpe ratio indicates better risk management.
7. Commission Costs: Factor in trading fees and commissions to ensure your net profits are accurate.
Regularly review these metrics to refine your strategies and improve your day trading performance.
Learn about How to Evaluate Day Trading Brokers
What are common mistakes with day trading metrics to avoid?

Common mistakes with day trading metrics include over-relying on a single indicator, ignoring volume trends, and neglecting risk management. Many traders misuse metrics like the average true range (ATR) without considering market context. Failing to account for slippage can distort profit calculations. Additionally, not tracking transaction costs can lead to inaccurate assessments of profitability. Lastly, overlooking the importance of setting clear entry and exit points can result in emotional trading decisions.
Learn about Common Mistakes in Day Trading Momentum Strategies
How can market news impact day trading metrics?
Market news can significantly impact day trading metrics by influencing stock volatility, liquidity, and price movement. For instance, positive earnings reports or economic data can lead to increased buying activity, boosting a stock's price and trading volume. Conversely, negative news may trigger sell-offs, causing sharp declines in stock prices and increased volatility. Traders often monitor news for real-time updates to adjust their strategies, using metrics like average volume and price changes to capitalize on market reactions. Thus, staying informed on market news is crucial for effective day trading.
Learn about How to Stay Updated on Crypto Market News for Day Trading
Conclusion about Key Metrics for Day Trading Stocks
Understanding key metrics is essential for successful day trading. By focusing on stock volatility, trading volume, and indicators like the average true range and bid-ask spread, traders can make informed decisions. Monitoring moving averages, performance indicators, and price action further enhances strategy effectiveness. Additionally, a clear grasp of risk-reward ratios, trending stock identification, and the impact of market news can significantly improve trading outcomes. For comprehensive insights and support in mastering these metrics, DayTradingBusiness is here to guide you.