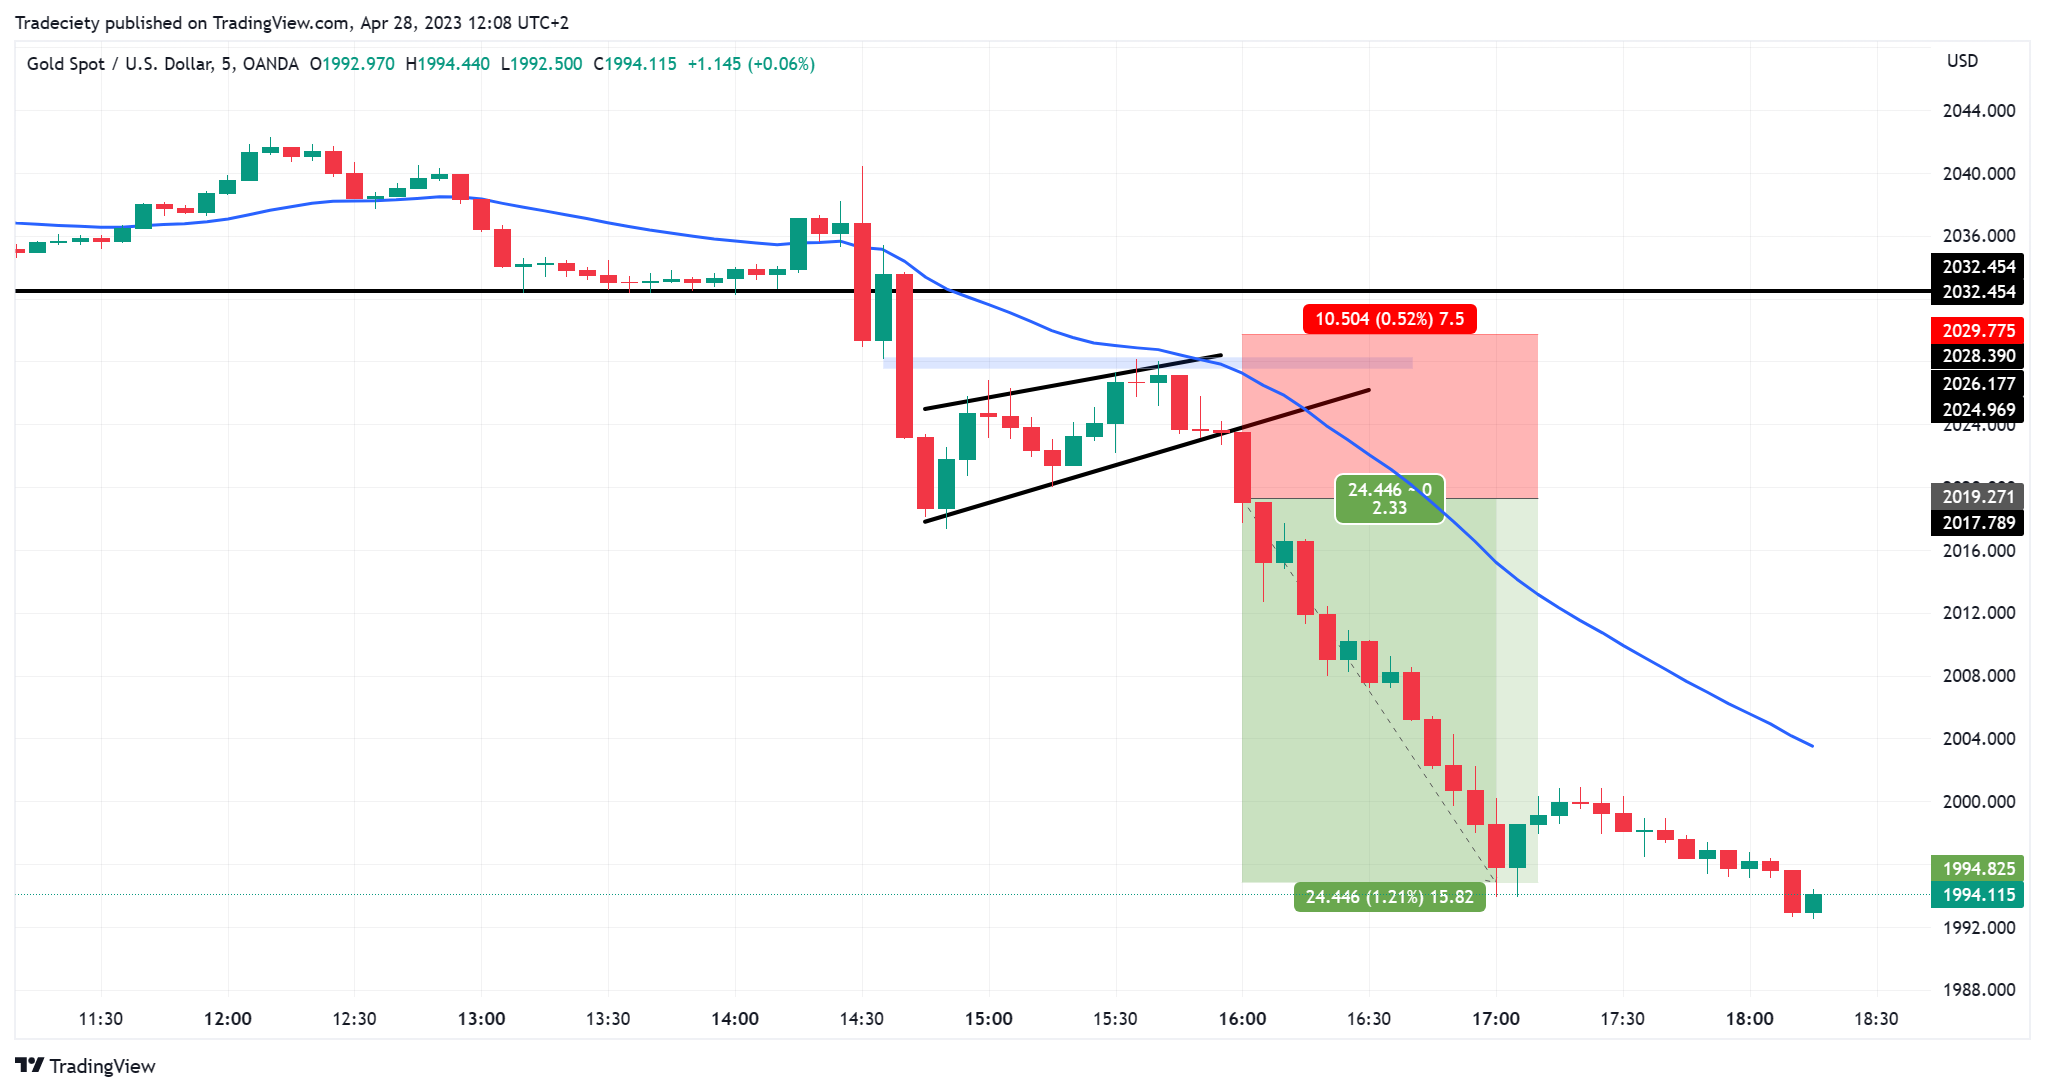
Did you know that the average human attention span is shorter than that of a goldfish? Luckily, in the fast-paced world of day trading, every second counts, especially when it comes to choosing the right timeframe for breakouts. In this article, we’ll explore the best timeframes for day trading breakouts, including the pros and cons of each option. You’ll learn how to select the right timeframe based on market conditions and your trading style, and discover why the 5-minute chart is a favorite among traders. We’ll also discuss the impact of news events, volatility, and even backtesting on your strategy. Whether you’re a novice or a seasoned trader, understanding these elements can significantly enhance your breakout trading performance. Dive in with DayTradingBusiness to refine your approach and maximize your results!
What are the best timeframes for day trading breakouts?
The best timeframes for day trading breakouts are usually 1-minute, 5-minute, and 15-minute charts. The 1-minute chart offers quick entry and exit points, ideal for fast-moving stocks. The 5-minute chart balances detail and speed, making it popular for capturing breakouts while allowing for some analysis. The 15-minute chart provides a broader view to identify significant trends and is helpful for spotting stronger breakouts. Choose based on your trading style and the volatility of the stock.
How do I choose the right timeframe for breakout trading?
To choose the right timeframe for breakout trading, focus on your trading style and objectives. For day trading, 1-minute to 15-minute charts are ideal for capturing quick moves. If you're looking for more substantial moves, consider 30-minute to 1-hour charts.
Evaluate market volatility and trading volume; higher volatility often favors shorter timeframes. Test different timeframes on a demo account to see which aligns best with your strategy and risk tolerance. Ultimately, the right timeframe is one that matches your ability to monitor trades and react quickly.
What are the pros and cons of different day trading timeframes?
Pros and Cons of Different Day Trading Timeframes for Breakouts:
1-Minute Timeframe:
– Pros: Quick entries and exits; captures rapid price movements; ideal for scalping.
– Cons: High noise; more false signals; requires constant monitoring.
5-Minute Timeframe:
– Pros: Balances speed and clarity; fewer false signals than 1-minute charts; good for quick trades.
– Cons: Still prone to noise; may miss larger moves; requires quick decision-making.
15-Minute Timeframe:
– Pros: Better trend visibility; reduces noise; suitable for capturing larger breakouts.
– Cons: Slower execution; might miss short-term opportunities; requires patience.
30-Minute Timeframe:
– Pros: Stronger trend confirmation; good for swing trades; less stressful than shorter timeframes.
– Cons: Slower response time; less frequent setups; can miss fast breakouts.
Hourly Timeframe:
– Pros: Clearer trend analysis; better for longer breakouts; fewer signals to analyze.
– Cons: Longer wait times; may miss quick market shifts; not ideal for active traders.
Choose a timeframe that aligns with your trading style and risk tolerance for optimal breakout strategies.
Why is the 5-minute chart popular for breakout trading?
The 5-minute chart is popular for breakout trading because it strikes a balance between speed and detail. Traders can quickly identify potential breakouts without the noise of lower timeframes. It allows for timely entry and exit points, optimizing profit potential. Additionally, the 5-minute chart captures intraday trends effectively, helping traders react to market movements while minimizing the risk of false signals.
Should I use the 15-minute or 30-minute chart for breakouts?
Use the 15-minute chart for breakouts if you're looking for quicker entry and exit points. It provides more frequent signals and can capture short-term price movements. The 30-minute chart is better for confirming breakouts with stronger trends and less noise. Choose based on your trading style: faster trades favor the 15-minute, while more cautious approaches benefit from the 30-minute.
How do hourly charts impact day trading breakout strategies?
Hourly charts provide a clearer view of price action and trends, making them essential for spotting breakout opportunities in day trading. They help traders identify key support and resistance levels, allowing for better entry and exit points. Breakouts on hourly charts often indicate stronger momentum, increasing the likelihood of sustained price movement. Additionally, they filter out noise from shorter timeframes, leading to more reliable signals. Overall, using hourly charts enhances decision-making and risk management in breakout strategies.
What timeframes do professional day traders prefer for breakouts?
Professional day traders typically prefer timeframes of 1 minute, 5 minutes, and 15 minutes for breakouts. These shorter timeframes allow for quick entries and exits, capturing rapid price movements. 1-minute charts are great for immediate reactions, while 5-minute and 15-minute charts help identify stronger trends and confirmation.
How can I identify breakouts on various timeframes?

To identify breakouts on various timeframes for day trading, focus on these key steps:
1. Select Your Timeframes: Use a combination of shorter timeframes (1-minute, 5-minute) for entry and slightly longer timeframes (15-minute, 30-minute) for trend confirmation.
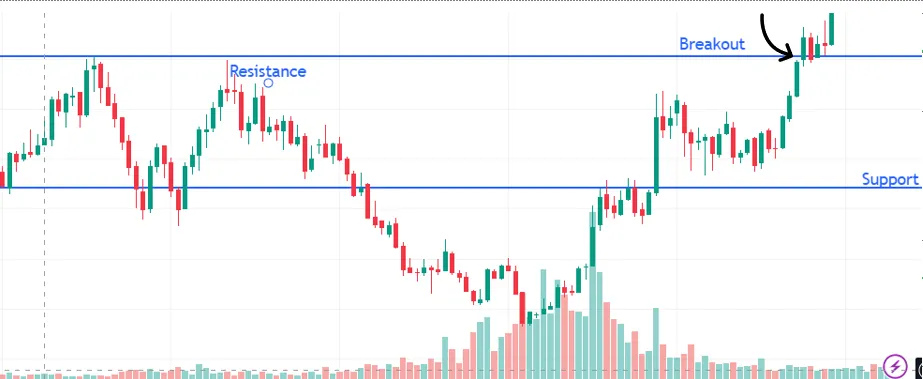
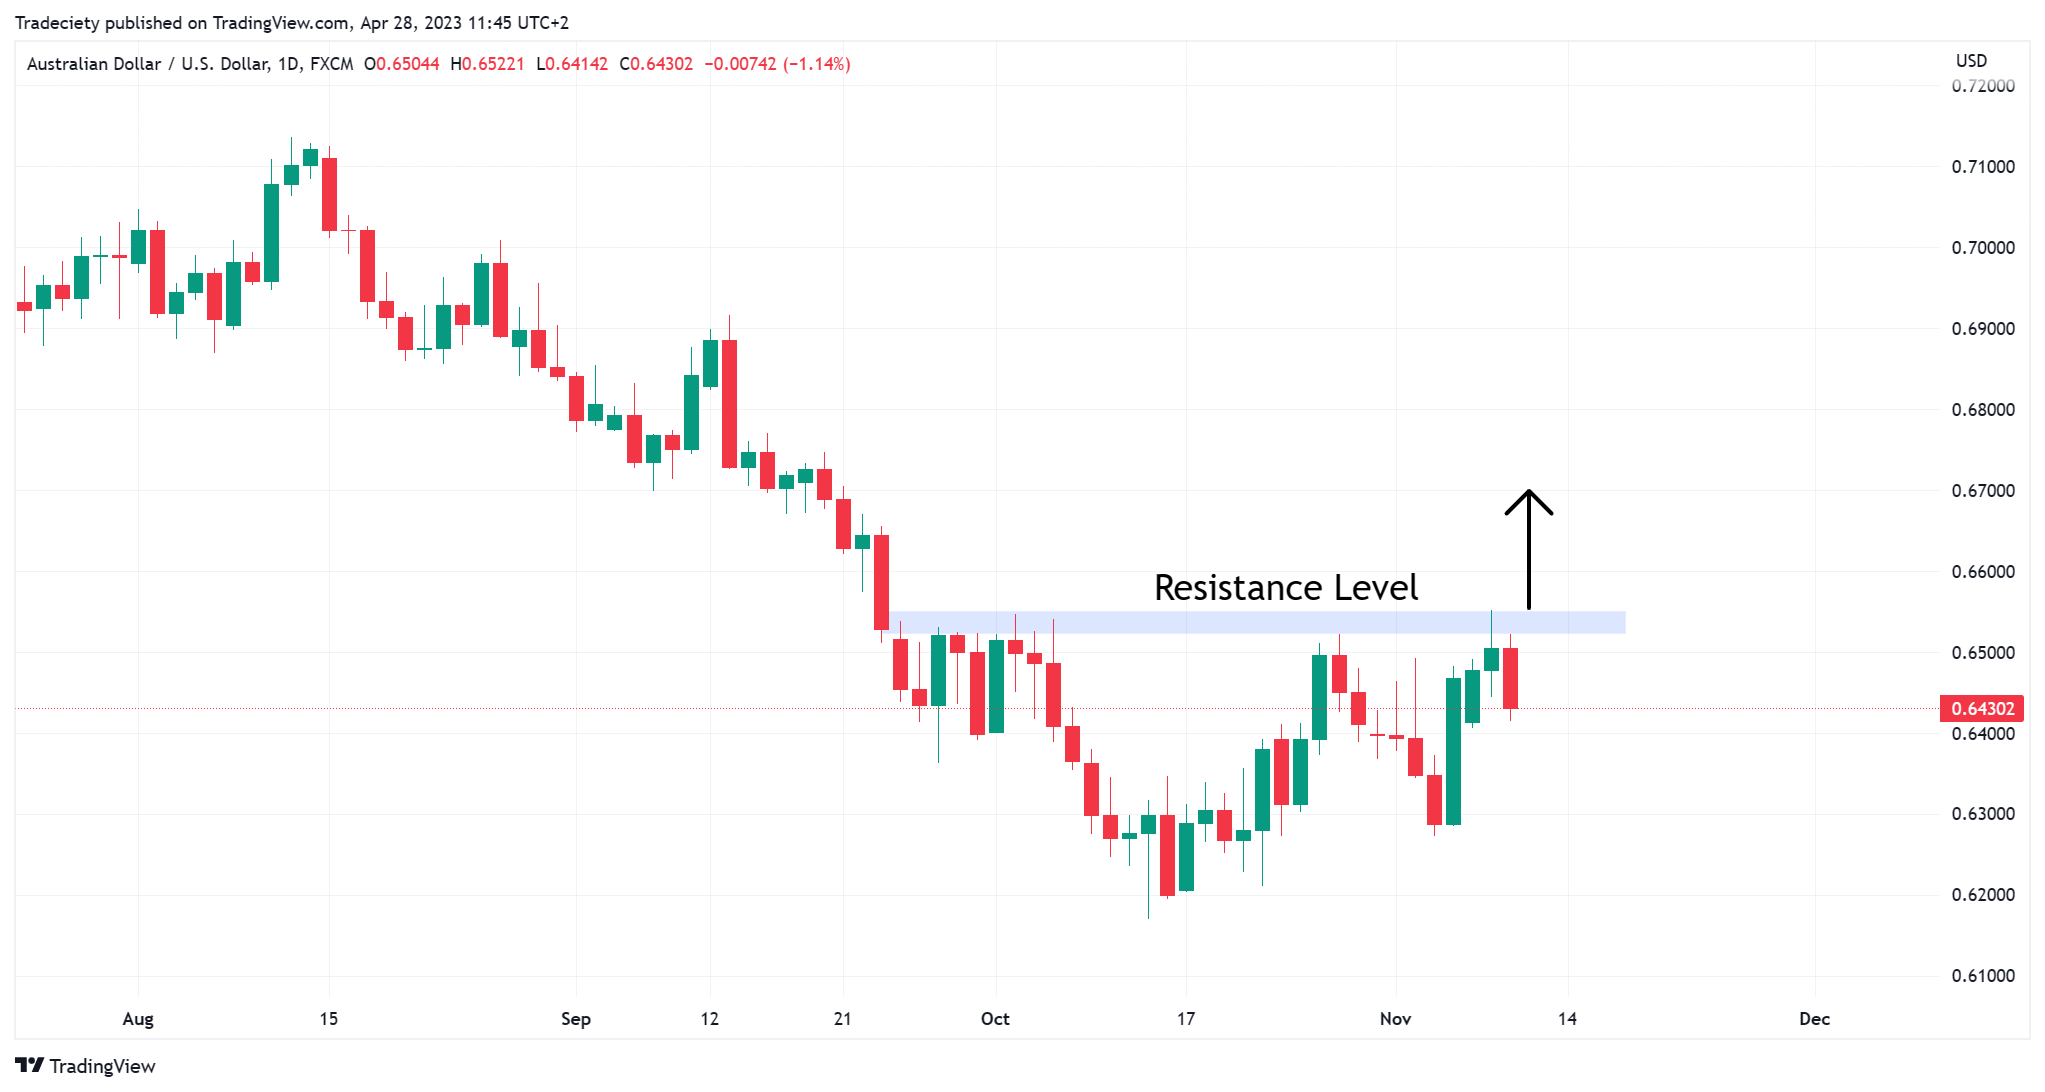
2. Look for Key Levels: Identify support and resistance levels. Breakouts occur when the price moves beyond these levels.
3. Volume Confirmation: Check for increased trading volume during a breakout. Higher volume indicates stronger momentum.
4. Candlestick Patterns: Watch for bullish or bearish candlestick patterns near key levels. Patterns like engulfing or hammer can signal potential breakouts.
5. Indicators: Utilize indicators like Bollinger Bands or Moving Averages. A price move outside these can indicate a breakout.
6. Watch for Consolidation: Breakouts often follow periods of consolidation. Identify ranges where price is trading sideways.
7. Set Alerts: Use alerts to notify you when prices approach breakout levels.
By combining these techniques across multiple timeframes, you can effectively spot breakouts and make informed trading decisions.
What is the significance of daily charts in breakout trading?

Daily charts are crucial in breakout trading because they provide a clear view of price trends and key support and resistance levels. These charts help traders identify potential breakout points and confirm patterns, making them reliable for setting entry and exit strategies. They also filter out noise from shorter timeframes, allowing traders to focus on significant market movements. By analyzing daily charts, traders can gauge overall market sentiment and make more informed decisions about when to enter or exit trades during breakouts.
How do market conditions affect the choice of timeframe?
Market conditions significantly influence the choice of timeframe for day trading breakouts. In volatile markets, shorter timeframes like 1-minute or 5-minute charts can capture rapid price movements and quick entries. Conversely, in stable conditions, longer timeframes such as 15-minute or 30-minute charts might provide clearer breakout signals with less noise.
Trends also matter; during strong trends, traders may favor shorter timeframes to maximize profit from quick moves. In choppy markets, longer timeframes can help filter out false breakouts. Ultimately, the choice of timeframe should align with the trader's strategy and the current market environment.
Can I use multiple timeframes for day trading breakouts?
Yes, you can use multiple timeframes for day trading breakouts. Many traders analyze a higher timeframe, like the 1-hour or 4-hour chart, to identify the overall trend and key levels. Then, they switch to a shorter timeframe, such as the 5-minute or 15-minute chart, to spot precise entry points for breakouts. This approach helps you align with the trend while capitalizing on short-term movements.
How do news events influence breakout timeframes?
News events can significantly impact breakout timeframes in day trading. When major news is released, it often leads to increased volatility and trading volume. This can shorten breakout timeframes, as traders react quickly to new information. Conversely, if news is expected but doesn't deliver, breakouts might take longer to develop as traders reassess their positions. The key is to stay alert to news headlines and economic reports, as they can accelerate or delay price movements.
What role does volatility play in selecting a timeframe for breakouts?
Volatility is crucial in selecting a timeframe for breakouts in day trading. Higher volatility suggests more significant price movements, making shorter timeframes, like 1-minute or 5-minute charts, suitable for capturing quick breakout opportunities. Conversely, lower volatility may require longer timeframes, such as 15-minute or hourly charts, to allow for clearer trend development before entering a trade. Assessing volatility helps traders align their strategies with market conditions, optimizing their chances of successful breakouts.
How can backtesting help determine the best timeframe?
Backtesting helps determine the best timeframe for day trading breakouts by allowing traders to analyze historical data on various timeframes. By testing different intervals—like 1-minute, 5-minute, or 15-minute charts—traders can identify which timeframe yields the highest success rate for breakouts. This analysis reveals patterns in price movement and helps refine entry and exit strategies. Ultimately, backtesting provides empirical evidence to support decisions, ensuring that the chosen timeframe aligns with the trader's goals and market behavior.
What are common mistakes when choosing timeframes for breakouts?

Common mistakes when choosing timeframes for breakouts in day trading include:
1. Ignoring Market Volatility: Selecting a timeframe that doesn’t align with current market conditions can lead to false signals.
2. Overly Short Timeframes: Using very short timeframes may result in noise and whipsaws, making it hard to identify genuine breakouts.
3. Lack of Confirmation: Relying on a single timeframe without confirming trends on higher timeframes can lead to missed opportunities or bad trades.
4. Inconsistent Timeframes: Switching between timeframes without a clear strategy can confuse decision-making.
5. Neglecting Volume: Failing to consider volume along with the timeframe can lead to ineffective breakout assessments.
6. Chasing Breakouts: Entering trades too late after a breakout has already occurred can increase risk.
Choose a timeframe that matches your trading style and objectives, and always confirm signals across multiple timeframes.
What Are the Best Timeframes for Day Trading Breakout Strategies?
Day trading breakout strategies focus on entering trades when the price breaks above resistance or below support levels. The best timeframes for day trading breakouts are typically 1-minute, 5-minute, and 15-minute charts, as they provide timely signals for quick trades.
Learn more about: What Are Day Trading Breakout Strategies?
Learn about Best Timeframes for Day Trading Scalping Strategies
How do I adapt my strategy based on different trading timeframes?
To adapt your strategy for different trading timeframes in day trading breakouts, focus on these key aspects:
1. Short Timeframes (1-5 minutes): Use quick entry and exit points. Look for immediate volume spikes and strong price action. Scalping strategies work well here.
2. Medium Timeframes (15-30 minutes): Identify clear trends and support/resistance levels. Use technical indicators like moving averages or RSI for confirmation before entering a trade.
3. Longer Timeframes (1 hour or more): Look for larger patterns and trends. Confirm breakouts with higher volume and news catalysts. This timeframe allows for more thorough analysis and reduces the impact of noise.
Adjust your risk management according to the timeframe; shorter timeframes require tighter stops, while longer ones allow for more flexibility. Always backtest your strategy for each timeframe to refine your approach.
Conclusion about Best Timeframes for Day Trading Breakouts
In summary, selecting the best timeframe for day trading breakouts is crucial for maximizing profits and minimizing risks. The choice between 5-minute, 15-minute, or hourly charts largely depends on your trading style, market conditions, and personal preferences. Understanding the pros and cons of each timeframe, along with the impact of volatility and news events, can refine your breakout strategies. Utilizing multiple timeframes and backtesting can further enhance your approach. For comprehensive insights and expert guidance on optimizing your trading strategies, consider leveraging the resources from DayTradingBusiness.
Learn about Best Timeframes for Day Trading Scalping Strategies