Did you know that the average trader spends more time analyzing charts than a chef spends perfecting a soufflé? In the fast-paced world of trading, understanding key indicators for breakout strategies can make all the difference. This article dives into essential indicators that signal potential breakout opportunities, including technical indicators and the impact of volume trends. You'll learn how to identify breakout stocks, the significance of support and resistance levels, and how chart patterns can indicate profitable trades. We also discuss the importance of market sentiment, volatility, and the influence of news events on breakout potential. Plus, discover common pitfalls, the role of moving averages, and the best tools for analysis. Finally, we highlight strategies for setting entry and exit points and how backtesting can refine your approach. With insights from DayTradingBusiness, you’ll be well-equipped to enhance your breakout trading success.
What are the key indicators for breakout strategies?
Key indicators for breakout strategies include:
1. Price Levels: Identify resistance and support levels where price tends to reverse.
2. Volume: Look for increasing volume on the breakout, confirming strength and interest.
3. Volatility: Use indicators like Bollinger Bands to assess when price is squeezing, indicating a potential breakout.
4. Moving Averages: Crossovers can signal shifts in momentum, suggesting possible breakouts.
5. Relative Strength Index (RSI): Overbought or oversold conditions can indicate potential breakouts.
6. Chart Patterns: Recognize patterns like triangles, flags, or head and shoulders that often precede breakouts.
Focus on these indicators to enhance your breakout strategy.
How can I identify potential breakout stocks?
To identify potential breakout stocks, look for these key indicators:
1. Volume Surge: A significant increase in trading volume can signal strong interest and potential price movement.
2. Price Patterns: Watch for chart patterns like flags, triangles, or bases that indicate consolidation before a breakout.
3. Resistance Levels: Stocks nearing key resistance levels may break out if they can cross and hold above those prices.
4. Earnings Reports: Positive earnings surprises can trigger breakouts, especially if accompanied by strong guidance.
5. Market News: Stay informed on news or developments that could impact a stock's sector or the broader market.
6. Technical Indicators: Use indicators like the Relative Strength Index (RSI) or Moving Averages to confirm upward momentum.
Combine these indicators to spot stocks that are likely to break out.
What technical indicators signal a breakout?
Key technical indicators that signal a breakout include:
1. Moving Averages: A price crossing above or below a moving average can indicate a potential breakout.
2. Volume: Increasing volume during price movement suggests strength behind a breakout.
3. Bollinger Bands: A price touching the upper or lower band can signal an impending breakout.
4. Relative Strength Index (RSI): An RSI above 70 or below 30 can indicate overbought or oversold conditions, hinting at a potential breakout.
5. MACD: A bullish crossover (MACD line crossing above the signal line) can signal a breakout to the upside, while a bearish crossover indicates a downside breakout.
6. Chart Patterns: Patterns like triangles, flags, or head and shoulders can forecast breakouts when price breaks key support or resistance levels.
Use these indicators in combination for more reliable breakout signals.
How do volume trends impact breakout strategies?
Volume trends are crucial for breakout strategies as they confirm the strength and validity of a price movement. A breakout accompanied by high volume indicates strong interest and increases the likelihood of a sustained move. Conversely, low volume during a breakout may signal a lack of conviction, increasing the risk of a false breakout. Traders often look for volume spikes at key resistance or support levels to validate their entries. In summary, integrating volume analysis helps enhance the effectiveness of breakout strategies.
What role do support and resistance levels play in breakouts?

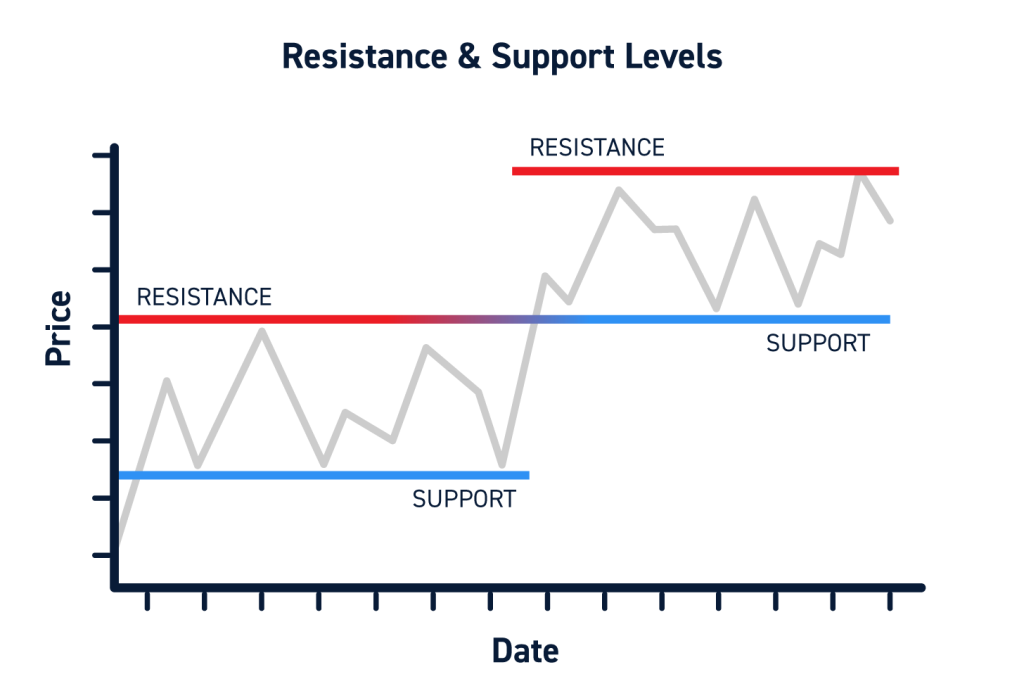
Support and resistance levels are crucial in breakout strategies as they indicate price points where the market tends to reverse or consolidate. When the price breaks above a resistance level, it suggests strong buying interest, signaling a potential upward trend. Conversely, if it breaks below a support level, it indicates selling pressure and a potential downward trend. Traders watch these levels to identify entry and exit points, increasing the likelihood of successful trades during breakouts.
How can chart patterns indicate a breakout opportunity?
Chart patterns indicate a breakout opportunity by showing key formations like triangles, flags, and head-and-shoulders. When prices consolidate within these patterns, they create tension. A breakout occurs when the price moves beyond the pattern's boundary, signaling a potential shift in momentum. Traders often look for increased volume accompanying the breakout, confirming the move. Monitoring key indicators like RSI or MACD can also help validate the breakout's strength.
What are the best timeframes for breakout trading?
The best timeframes for breakout trading are typically the 15-minute, 1-hour, and daily charts. Shorter timeframes like the 5-minute can capture quick moves, while daily charts offer a broader perspective for significant breakouts. Look for key indicators such as volume spikes, volatility, and momentum to confirm breakouts across these timeframes.
How does market sentiment influence breakout strategies?
Market sentiment significantly influences breakout strategies by shaping traders' expectations and decisions. Positive sentiment can lead to increased buying pressure, driving prices above key resistance levels, while negative sentiment may result in selling pressure that prevents breakouts. Key indicators include volume spikes, which signal strong interest, and momentum indicators like RSI that show overbought or oversold conditions. News events and social media trends also impact sentiment, creating opportunities for breakouts when traders react swiftly to new information. Understanding sentiment helps traders anticipate potential price movements and validate breakout signals.
What Key Indicators Should I Use for Day Trading Breakout Strategies?

Key indicators for breakout strategies include price volume spikes, moving average crossovers, support and resistance levels, and volatility indicators like the Bollinger Bands. Traders often look for increased volume on breakout attempts to confirm the move, while chart patterns such as triangles or flags signal potential breakouts.
Learn more about: What Are Day Trading Breakout Strategies?
What is the significance of volatility in breakout trading?
Volatility is crucial in breakout trading because it signals potential price movements. High volatility indicates that a stock is experiencing significant price changes, which can lead to strong breakouts. Traders look for increased volatility to confirm that a breakout is genuine rather than a false signal. It helps in setting stop-loss orders and determining entry points, maximizing profit potential while minimizing risk. Essentially, volatility helps traders identify the best opportunities for profitable breakouts.
How do news events affect breakout potential?
News events can significantly impact breakout potential by influencing market sentiment and volatility. Positive news can drive prices above resistance levels, while negative news may lead to breakdowns below support. Key indicators to watch include trading volume spikes, price action following news releases, and the reaction of major market players. For instance, a strong earnings report can catalyze a breakout, while geopolitical tensions might trigger a pullback. Always monitor the news cycle to gauge how it shapes market movements for effective breakout strategies.
What are the common mistakes in breakout trading?
Common mistakes in breakout trading include:
1. Entering Too Early: Traders often jump in before a confirmed breakout, leading to false signals.
2. Ignoring Volume: A breakout lacks strength without significant volume. Low volume can indicate a weak move.
3. Setting Tight Stop-Losses: Placing stop-losses too close can result in getting stopped out before the move develops.
4. Overtrading: Traders might chase multiple breakouts simultaneously, spreading their focus too thin.
5. Neglecting Market Conditions: Failing to consider overall market trends can lead to misguided breakout trades.
6. Not Having a Clear Exit Plan: Entering without a defined exit strategy can result in missed profits or larger losses.
7. Emotional Decision-Making: Allowing fear or greed to dictate trades can derail a breakout strategy.
Avoiding these mistakes can improve breakout trading success.
How can I use moving averages in breakout strategies?
Use moving averages to identify breakout points by following these steps:
1. Trend Confirmation: Use a short-term moving average (like the 20-day) to confirm the trend direction. If the price is above the moving average, look for bullish breakouts; if below, look for bearish ones.
2. Crossovers: Watch for crossovers between short-term and long-term moving averages (like the 50-day). A bullish crossover signals a potential breakout to the upside; a bearish crossover indicates a possible downside breakout.
3. Support and Resistance: Use moving averages as dynamic support or resistance levels. A price breaking above a moving average suggests a bullish breakout, while breaking below signals a bearish breakout.
4. Combine with Volume: Confirm breakouts with volume. A breakout accompanied by high volume indicates strength, while low volume may suggest a false breakout.
5. Set Entry Points: Enter trades when the price breaks above or below the moving average with confirmation from other indicators like RSI or MACD.
By effectively using moving averages in your breakout strategy, you can enhance your entry points and improve your trading decisions.
What tools and software can assist with breakout analysis?
Key tools for breakout analysis include:
1. TradingView: Offers advanced charting and technical indicators for identifying breakouts.
2. MetaTrader 4/5: Provides customizable indicators and expert advisors for breakout strategies.
3. Thinkorswim: Features powerful charting tools and alerts for monitoring breakout conditions.
4. StockCharts: Allows for technical analysis with a focus on breakout patterns.
5. NinjaTrader: Supports automated trading strategies and real-time market analysis for breakouts.
Using these tools can enhance your ability to spot key indicators and execute effective breakout strategies.
How do I set entry and exit points for breakouts?
To set entry and exit points for breakouts, start by identifying key support and resistance levels. For entry, place a buy order slightly above the resistance level or a sell order just below the support level. Use indicators like volume to confirm the breakout; higher volume suggests stronger momentum.
For exit points, consider using a risk-reward ratio of at least 1:2. You can also set profit targets at the next significant resistance level for long positions or the next support level for short positions. Trailing stops can help lock in profits as the trade moves in your favor.
What strategies can enhance breakout trading success?

1. Volume Analysis: Look for increased trading volume during the breakout. This confirms strength and validates the move.
2. Support and Resistance Levels: Identify clear support and resistance levels. A breakout above resistance or below support is more reliable.
3. Chart Patterns: Use patterns like flags, triangles, or head and shoulders to anticipate breakouts and improve entry points.
4. Momentum Indicators: Employ indicators like RSI or MACD to gauge momentum. A rising RSI can signal a strong breakout.
5. Timeframe Consideration: Focus on multiple timeframes. A breakout on a longer timeframe is generally more significant.
6. News and Events: Stay updated on relevant news that could drive price movement. Major announcements can trigger breakouts.
7. Stop-Loss Placement: Set stop-loss orders just below the breakout point to manage risk effectively.
8. Profit Targets: Establish clear profit targets based on previous price action or Fibonacci levels to ensure disciplined exits.
How can backtesting improve my breakout strategy?
Backtesting improves your breakout strategy by allowing you to test it against historical data, helping you identify its effectiveness. You can analyze key indicators like price action, volume spikes, and volatility to determine optimal entry and exit points. This process reveals potential weaknesses and strengths, enabling you to refine your strategy before risking real capital. Additionally, backtesting helps you set realistic profit targets and stop-loss levels based on past performance.
Conclusion about Key Indicators for Breakout Strategies
In summary, mastering breakout strategies requires a keen understanding of key indicators, including volume trends, support and resistance levels, and chart patterns. By leveraging technical indicators and considering market sentiment, traders can identify potential breakout stocks effectively. Utilizing tools and software for analysis, alongside proper entry and exit points, can enhance your trading success. Avoiding common pitfalls and incorporating backtesting into your strategy will further refine your approach. For comprehensive insights and guidance on implementing these strategies effectively, DayTradingBusiness offers valuable resources to elevate your trading journey.