Did you know that the term "momentum" in trading is not just about speed but also about riding the wave of market psychology? In this article, we dive into the essential key indicators for momentum day trading, helping you identify winning stocks and technical indicators that signal potential trades. Discover how moving averages and volume indicators can enhance your strategy, along with the role of RSI and MACD in gauging market momentum. We also cover the best chart patterns, the impact of news, and effective risk management techniques. Plus, learn how to backtest your strategies for optimal results. With insights from DayTradingBusiness, you'll be equipped to navigate the fast-paced world of momentum day trading confidently.
What are the key indicators for momentum day trading?
Key indicators for momentum day trading include:
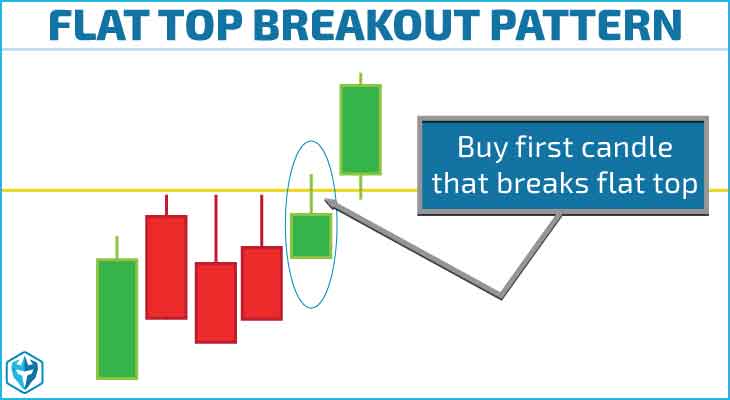
1. Price Action: Look for strong price movements, especially breakouts above resistance or below support levels.
2. Volume: High trading volume confirms the strength of a price move. Watch for volume spikes during breakouts.
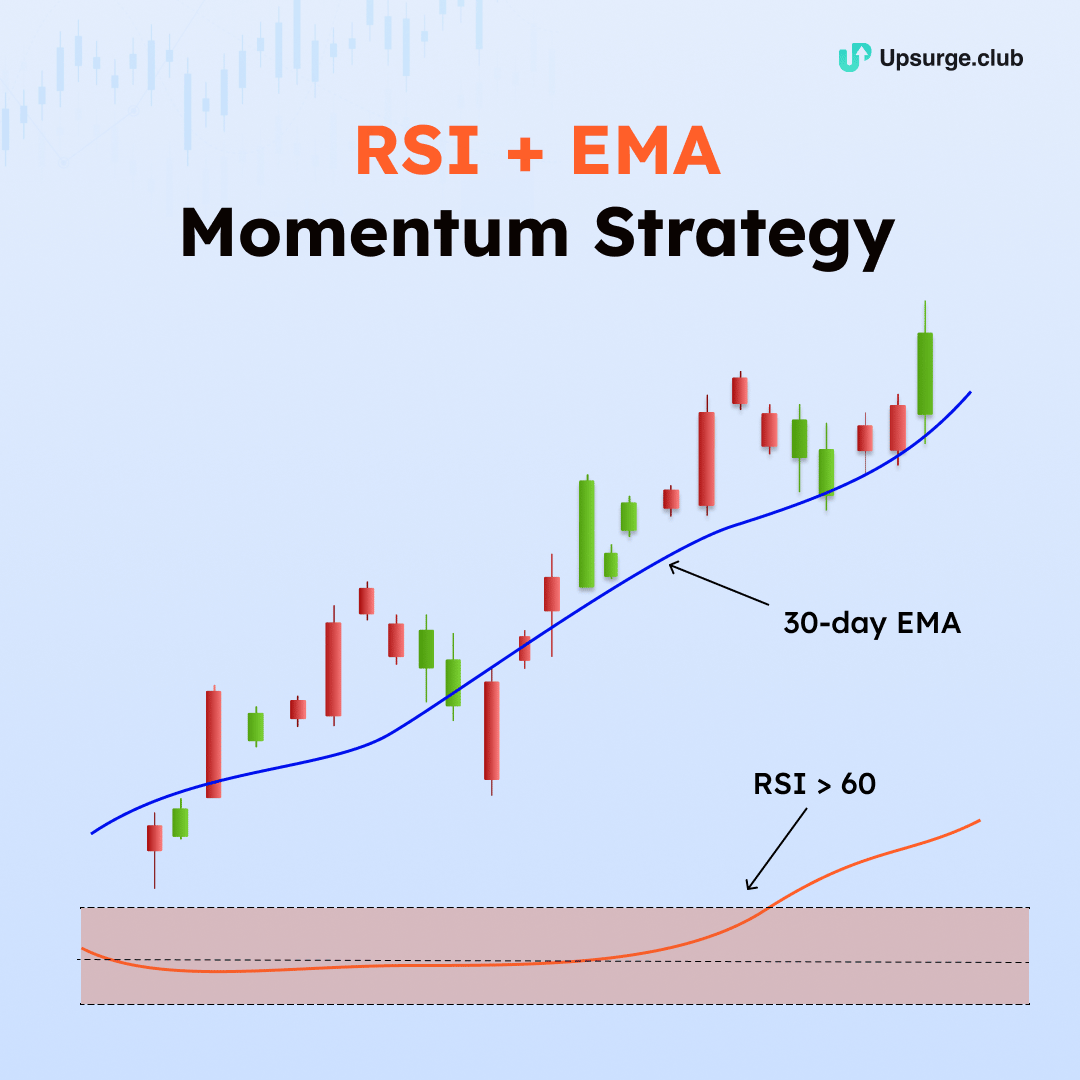
3. Relative Strength Index (RSI): Use RSI to identify overbought or oversold conditions. An RSI above 70 may indicate overbought, while below 30 suggests oversold.
4. Moving Averages: Simple moving averages (SMA) or exponential moving averages (EMA) can help identify trends. A crossover of a short-term average above a long-term average signals upward momentum.
5. Bollinger Bands: These show volatility. A price touching the upper band may indicate strong upward momentum, while touching the lower band suggests downward momentum.
6. Momentum Indicators: Tools like the MACD (Moving Average Convergence Divergence) indicate the strength of trends. A MACD line crossing above the signal line can signal buy opportunities.
7. News Catalysts: Stay aware of news events that can drive momentum, such as earnings reports or economic data releases.
Use these indicators to identify and capitalize on momentum in day trading.
How do I identify momentum stocks for day trading?
To identify momentum stocks for day trading, focus on these key indicators:
1. Price Movement: Look for stocks with significant price increases (typically 5% or more) within a single day.
2. Volume: High trading volume indicates strong interest. Aim for stocks with volume at least double the average.
3. Relative Strength Index (RSI): An RSI above 70 suggests a stock is overbought, while below 30 indicates it may be oversold.
4. Moving Averages: Use short-term moving averages (like 5-day and 10-day) crossing above longer ones (like 50-day) as a bullish signal.
5. News Catalyst: Monitor news, earnings reports, or press releases that can drive significant price changes.
6. Sector Movement: Check if the stock is part of a trending sector; momentum often follows sector performance.
Combine these indicators for a robust strategy in spotting momentum stocks.
What technical indicators are best for momentum trading?
The best technical indicators for momentum trading are:
1. Relative Strength Index (RSI): Measures the speed and change of price movements. Values above 70 indicate overbought conditions, while below 30 suggests oversold.
2. Moving Average Convergence Divergence (MACD): Shows the relationship between two moving averages. Look for crossovers and divergence to identify momentum shifts.
3. Average True Range (ATR): Indicates volatility, helping traders gauge potential price movement to set stop-loss levels.
4. Momentum Indicator: Directly measures the rate of price changes. A rising momentum value indicates strengthening trends.
5. Volume: High trading volume confirms momentum. Look for spikes in volume alongside price movements.
Using these indicators together can enhance momentum trading strategies effectively.
How do moving averages signal momentum in day trading?
Moving averages signal momentum in day trading by smoothing price data to identify trends. When a short-term moving average crosses above a long-term moving average, it indicates upward momentum, suggesting a buy signal. Conversely, if the short-term moving average crosses below the long-term moving average, it shows downward momentum, signaling a potential sell. Traders often use the 50-day and 200-day moving averages for longer trends, while shorter averages like the 10-day or 20-day can highlight quick momentum shifts. The distance between the moving averages also reflects the strength of the momentum: wider gaps suggest strong trends, while narrow gaps indicate potential reversals.
What role do volume indicators play in momentum trading?
Volume indicators are crucial in momentum trading as they confirm the strength of price movements. High volume during a price increase suggests strong buying interest, supporting an uptrend. Conversely, high volume on a price drop indicates strong selling pressure, validating a downtrend. Low volume can signal weak momentum, suggesting that a price move may not sustain. Traders often use volume to identify potential reversals or continuations, making it essential for making informed trading decisions.
How can I use RSI for momentum day trading?

To use RSI for momentum day trading, follow these steps:
1. Identify Overbought/Oversold Levels: Look for RSI readings above 70 (overbought) and below 30 (oversold). This indicates potential reversal points.
2. Confirm Momentum: Use RSI divergence. If the price makes a new high but RSI doesn’t, it signals weakening momentum, suggesting a potential reversal.
3. Set Entry Points: Buy when RSI crosses above 30 from below, indicating rising momentum. Sell or short when it crosses below 70 from above.
4. Combine with Other Indicators: Use RSI alongside moving averages or volume to validate signals and enhance accuracy.
5. Manage Risk: Set stop-loss orders based on recent price action to protect against false signals.
By focusing on these strategies, you can effectively leverage RSI to identify and act on momentum trades.
What is MACD and how is it used in momentum trading?
MACD, or Moving Average Convergence Divergence, is a momentum indicator that shows the relationship between two moving averages of a security’s price. It consists of the MACD line, signal line, and histogram. Traders use MACD to identify potential buy and sell signals based on momentum shifts.
In momentum trading, a bullish signal occurs when the MACD line crosses above the signal line, suggesting an upward price movement. Conversely, a bearish signal appears when the MACD line crosses below the signal line, indicating potential downward momentum. The histogram helps visualize these changes, providing clarity on the strength of the trend.
How do I set up a momentum trading strategy?
To set up a momentum trading strategy, follow these steps:
1. Choose Key Indicators: Use the Relative Strength Index (RSI), Moving Average Convergence Divergence (MACD), and the Average True Range (ATR) to identify momentum.
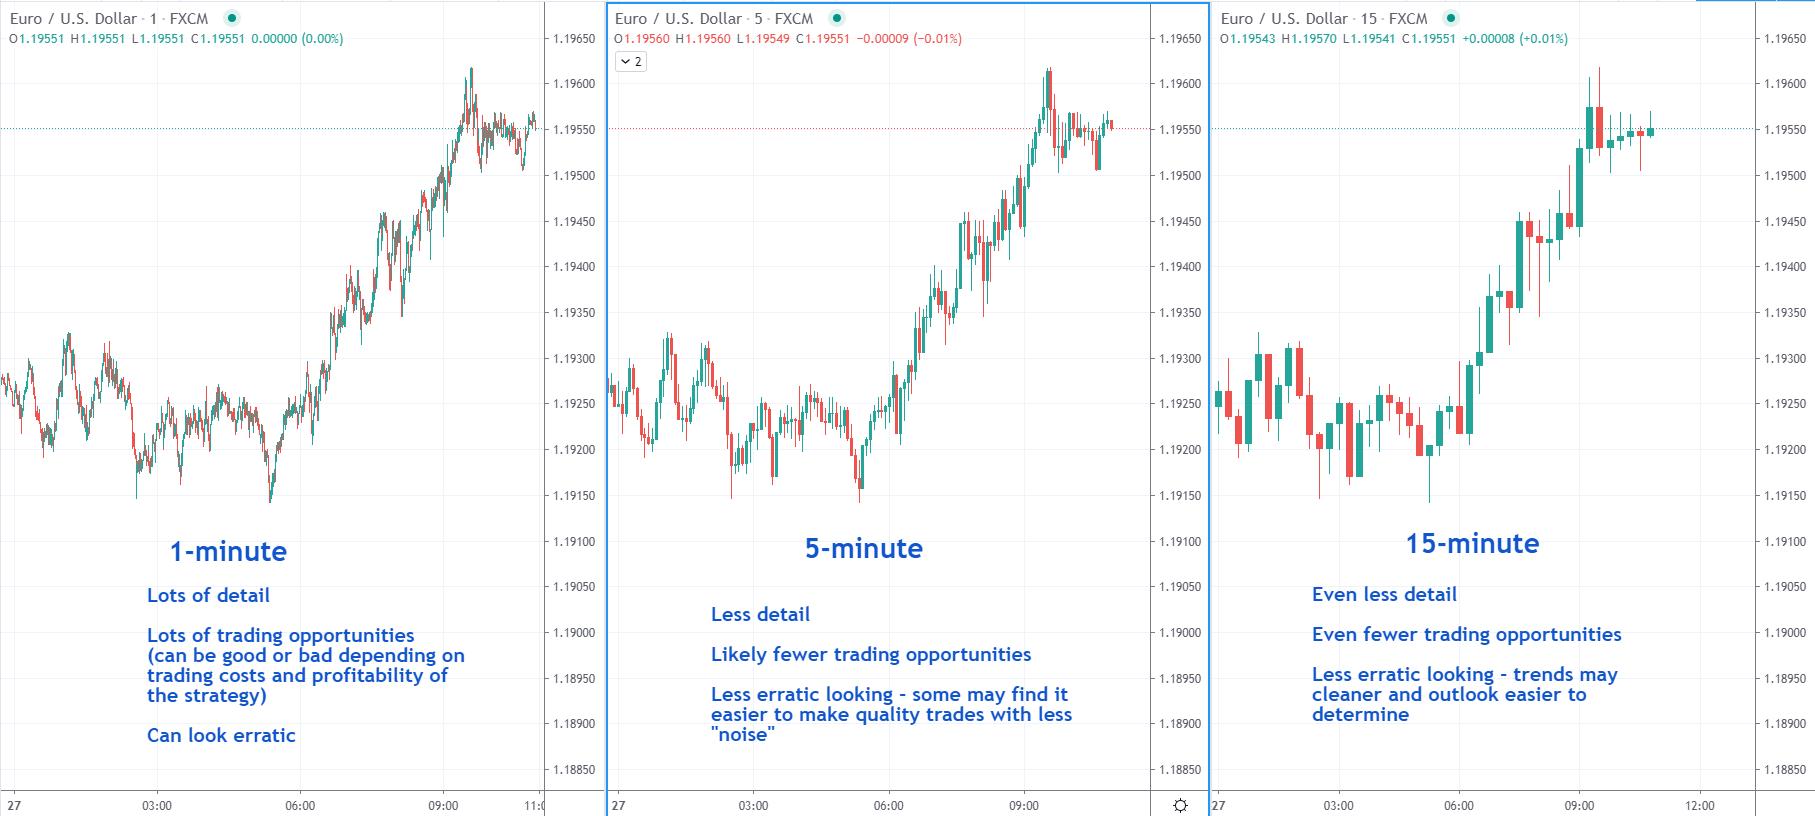
2. Select a Time Frame: Decide on a time frame for your trades, such as 1-minute, 5-minute, or daily charts, depending on your trading style.
3. Identify Entry Points: Look for stocks with strong upward or downward movement. Enter trades when the RSI crosses above 70 for bullish momentum or below 30 for bearish momentum.
4. Set Stop Loss and Take Profit: Determine your risk tolerance. Set a stop loss below recent support for long trades or above resistance for short trades. Aim for a risk-reward ratio of at least 1:2.
5. Monitor Volume: Ensure that trade volume supports the price movement. High volume confirms momentum.
6. Keep a Trading Journal: Record your trades, strategies, and outcomes to refine your approach over time.
7. Review Regularly: Analyze your results and adjust your indicators or strategy as needed.
Implement these steps consistently for effective momentum day trading.
What are the best chart patterns for momentum day trading?

The best chart patterns for momentum day trading include:
1. Bullish Flag: A strong price move followed by a consolidation period; signals continuation.
2. Bearish Flag: Similar to the bullish flag but indicates a downward trend.
3. Ascending Triangle: Higher lows with a flat top; suggests a breakout to the upside.
4. Descending Triangle: Lower highs with a flat bottom; indicates potential downward breakout.
5. Cup and Handle: A rounded bottom followed by a consolidation before a breakout; shows strong bullish momentum.
6. Head and Shoulders: A reversal pattern that indicates a trend change from bullish to bearish.
7. Inverse Head and Shoulders: Opposite of head and shoulders; indicates potential reversal from bearish to bullish.
Focus on these patterns to identify high-probability trades in momentum day trading.
How can news impact momentum trading indicators?
News can significantly impact momentum trading indicators by causing sudden price movements and volatility. Positive news can lead to rapid increases in volume and price, pushing indicators like the Relative Strength Index (RSI) and Moving Average Convergence Divergence (MACD) into overbought territory. Conversely, negative news can trigger sharp declines, causing indicators to show oversold conditions. Traders often monitor news to anticipate these shifts, adjusting their strategies based on how news events align with momentum signals.
What are the risks associated with momentum day trading?
The risks associated with momentum day trading include:
1. High Volatility: Prices can change rapidly, leading to significant losses.
2. False Signals: Indicators may suggest a trend that quickly reverses, causing unexpected losses.
3. Overtrading: The excitement of momentum can lead to excessive trades, increasing transaction costs and risk exposure.
4. Liquidity Issues: In some cases, there may not be enough buyers or sellers, making it hard to exit positions without losing money.
5. Emotional Decision-Making: The pressure to act quickly can result in poor judgment and impulsive trades.
6. Market Gaps: Prices can jump at market open or close, leading to orders being executed at unexpected prices.
Understanding these risks is crucial for anyone engaging in momentum day trading.
How do I manage risk when trading on momentum?
To manage risk when trading on momentum, focus on these key indicators:
1. Volume: Look for high trading volume to confirm momentum. If prices rise on low volume, it may indicate weakness.
2. Moving Averages: Use short-term moving averages (like the 9 or 20-day) to identify trends. A crossover can signal entry or exit points.
3. Relative Strength Index (RSI): Monitor the RSI for overbought or oversold conditions. An RSI above 70 may suggest a pullback is coming.
4. ATR (Average True Range): Use ATR to gauge volatility and set stop-loss levels. This helps avoid getting stopped out prematurely.
5. Chart Patterns: Identify patterns like flags or pennants that indicate continuation of momentum.
6. News Catalysts: Pay attention to news or earnings reports that can impact price movement.
Combine these indicators to create a structured approach, set clear stop-loss orders, and limit your position sizes to manage overall risk effectively.
What timeframes are ideal for momentum day trading?

The ideal timeframes for momentum day trading are typically 1-minute, 5-minute, and 15-minute charts. The 1-minute chart offers quick signals for fast trades, the 5-minute chart provides a balance between speed and clarity, while the 15-minute chart helps identify stronger trends and support/resistance levels. Use these timeframes to capture rapid price movements and confirm entries with volume and momentum indicators.
What Key Indicators Should I Use for Day Trading Momentum Strategies?
Day trading momentum strategies involve buying stocks that are trending upwards and selling those that are trending downwards. Key indicators for momentum day trading include price movement, volume spikes, and technical indicators like the Relative Strength Index (RSI) and Moving Average Convergence Divergence (MACD). Traders often look for patterns such as breakouts above resistance levels or significant news events that drive momentum.
Learn more about: What Are Day Trading Momentum Strategies?
Learn about Key Indicators for Day Trading Reversals
How can I use candlestick patterns for momentum trading?
Use candlestick patterns to identify momentum by looking for strong bullish or bearish formations. Key patterns include:
1. Bullish Engulfing: Indicates potential upward momentum when a larger green candle engulfs a preceding red candle.
2. Bearish Engulfing: Signals possible downward momentum when a larger red candle engulfs a preceding green candle.
3. Hammer: Suggests a reversal, especially if it appears after a downtrend, indicating potential upward momentum.
4. Shooting Star: Indicates a potential reversal after an uptrend, signaling a possible downward momentum.
Combine these patterns with volume analysis; high volume on a breakout reinforces momentum. Look for patterns at key support and resistance levels to increase reliability. Always confirm with additional indicators, like RSI or MACD, for stronger signals.
What psychological factors affect momentum day trading?
Momentum day trading is influenced by several psychological factors:
1. Fear and Greed: Traders often act on emotional impulses, leading to fear of missing out (FOMO) or panic selling.
2. Confirmation Bias: Traders may focus on information that supports their strategies, ignoring contrary signals.
3. Loss Aversion: The fear of losing can cause traders to hold onto losing positions too long or exit winning trades too early.
4. Overconfidence: Traders might overestimate their skills or the reliability of their predictions, leading to risky decisions.
5. Herd Behavior: Many traders follow the crowd, which can amplify trends and create volatile movements.
6. Mental Fatigue: Extended trading sessions can lead to decision fatigue, impacting judgment and strategy execution.
Understanding these factors can help traders manage emotions and improve their decision-making in momentum day trading.
How do I backtest momentum trading indicators effectively?
To backtest momentum trading indicators effectively, follow these steps:
1. Select Indicators: Choose key momentum indicators like the Relative Strength Index (RSI), Moving Average Convergence Divergence (MACD), or Average True Range (ATR).
2. Define Strategy: Specify entry and exit criteria based on the selected indicators. For example, buy when RSI crosses above 30 and sell when it crosses below 70.
3. Gather Historical Data: Obtain high-quality historical price data for the assets you want to trade.
4. Use Backtesting Software: Utilize software like TradingView or MetaTrader to input your strategy and analyze historical performance.
5. Run Simulations: Execute backtests across various timeframes and market conditions to assess the robustness of your strategy.
6. Analyze Results: Examine key metrics like win rate, profit factor, and maximum drawdown to evaluate effectiveness.
7. Refine Strategy: Adjust your indicators and parameters based on backtest results to improve performance.
8. Forward Test: After backtesting, apply your refined strategy in a simulated environment before trading with real capital.
By following these steps, you can effectively test momentum trading indicators and enhance your trading strategy.
Conclusion about Key Indicators for Momentum Day Trading
In summary, mastering momentum day trading requires a strong grasp of key indicators such as moving averages, RSI, MACD, and volume analysis. Identifying momentum stocks and understanding the impact of news can enhance your trading strategy. Incorporate effective risk management techniques and suitable timeframes to improve your trading outcomes. With the right tools and knowledge, you can navigate the complexities of momentum trading successfully. For deeper insights and guidance, turn to DayTradingBusiness for comprehensive support in your trading journey.
Learn about Key Indicators for Day Trading Reversals