Did you know that some day traders have a better chance of spotting a reversal than a cat has of landing on its feet? In the fast-paced world of day trading, mastering reversal strategies is crucial for capitalizing on market shifts. This article explores the best reversal strategies for day traders, from identifying patterns and using key indicators to understanding the psychological factors at play. Learn how volume influences reversals, the significance of support and resistance levels, and the role of candlestick patterns. We’ll also discuss risk management, backtesting techniques, and pitfalls to avoid. With insights tailored for forex day trading and expert approaches, this guide by DayTradingBusiness equips you with the tools to navigate market reversals effectively.
What are the best reversal strategies for day traders?
The best reversal strategies for day traders include:
1. Candlestick Patterns: Look for key patterns like hammers, shooting stars, and engulfing patterns that indicate potential reversals.
2. Divergence: Use indicators like RSI or MACD to spot divergence between price action and indicator movement, signaling a possible trend reversal.
3. Support and Resistance Levels: Identify strong support or resistance levels; reversals often occur when price approaches these zones.
4. Moving Averages: Watch for crossovers of short-term and long-term moving averages, which can indicate a shift in trend.
5. Volume Analysis: Increased volume during a reversal pattern can confirm the strength of the reversal.
6. Fibonacci Retracement: Use Fibonacci levels to find potential reversal points during retracements in a trending market.
7. News Catalysts: Stay aware of news events that can lead to abrupt price reversals, adjusting strategies accordingly.
Apply these strategies with proper risk management for effective day trading.
How do you identify reversal patterns in day trading?
To identify reversal patterns in day trading, look for key signals like a Head and Shoulders formation, Double Tops and Bottoms, or Candlestick patterns such as Engulfing and Hammer. Monitor price action for sudden shifts in momentum, especially after strong trends. Use volume as a confirmation tool; increasing volume during a reversal adds credibility to the pattern. Additionally, check for divergences between price and indicators like RSI or MACD. Finally, set alerts for critical support and resistance levels where reversals are likely to occur.
What indicators help in spotting market reversals?
Key indicators for spotting market reversals include:
1. Candlestick Patterns: Look for formations like hammers, engulfing patterns, or dojis at key support or resistance levels.
2. Divergence: Monitor discrepancies between price movements and indicators like the RSI or MACD. For instance, if prices make new highs but RSI shows lower highs, a reversal may be near.
3. Volume Analysis: A surge in volume during price declines or rises often signals potential reversals. Higher volume on a reversal candlestick strengthens its validity.
4. Moving Averages: Crossovers, such as a short-term moving average crossing above a long-term moving average, can indicate a trend reversal.
5. Support and Resistance Levels: Price reactions at established support or resistance levels can signal a reversal, especially if combined with other indicators.
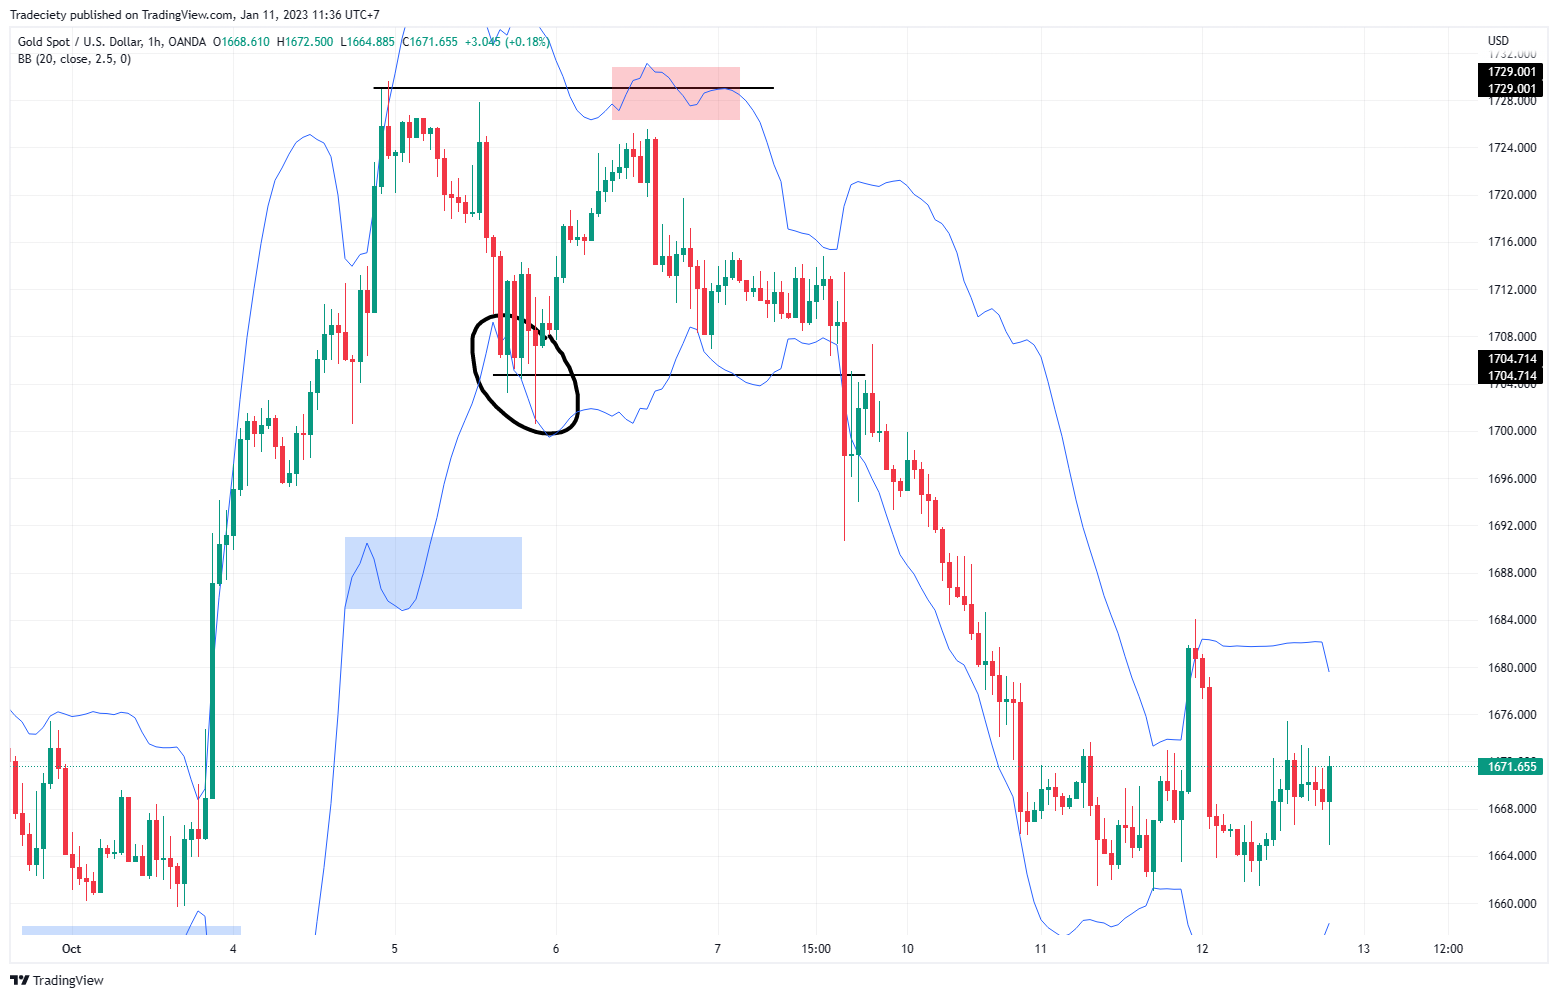
6. Bollinger Bands: When price touches or exceeds the outer bands and then reverses, it can signal an impending reversal.
Use these tools in conjunction for stronger confirmation of potential market reversals.
How can candlestick patterns signal reversals?
Candlestick patterns indicate reversals by showing shifts in market sentiment. For instance, a hammer pattern at the bottom of a downtrend suggests buyers are stepping in, signaling a potential upward reversal. Conversely, a shooting star at the top of an uptrend indicates that sellers are gaining strength, hinting at a possible downward reversal.
Key reversal patterns include:
1. Engulfing Pattern: A larger candle completely engulfs the previous one, signaling a shift.
2. Doji: When the open and close are nearly the same, it suggests indecision, often preceding a reversal.
3. Morning Star: A bullish reversal pattern formed by three candles: a down candle, a small candle, and a up candle.
Day traders can use these patterns alongside volume spikes for confirmation, enhancing their reversal strategies.
What role does volume play in reversal trading strategies?
Volume is crucial in reversal trading strategies because it confirms potential trend changes. High volume during a price reversal signals strong interest and validates the move, making it more likely to succeed. Conversely, low volume can indicate weak support for a reversal, suggesting the trade might fail. Day traders often look for spikes in volume as a signal to enter or exit positions effectively.
How do you use support and resistance for reversals?
To use support and resistance for reversals in day trading, first identify key support and resistance levels on your charts. Look for price action that approaches these levels. If the price hits a support level and shows signs of a bounce, like a bullish candlestick pattern, consider entering a long position. Conversely, if it reaches a resistance level and forms bearish signals, like a shooting star, consider shorting. Always confirm with additional indicators, such as volume or RSI, to strengthen your reversal signal. Setting stop-loss orders just beyond the support or resistance level helps manage risk.
What are some common reversal strategies for forex day trading?
Common reversal strategies for forex day trading include:
1. Candlestick Patterns: Look for formations like hammers, engulfing patterns, or dojis at key support or resistance levels to signal potential reversals.
2. Divergence: Identify divergence between price and indicators like RSI or MACD. When price makes a new high or low but the indicator does not, it can indicate a reversal.
3. Fibonacci Retracement: Use Fibonacci levels to spot potential reversal zones. Price often reverses at these key retracement levels.
4. Moving Average Crossovers: Watch for short-term moving averages crossing above or below long-term averages, suggesting a potential trend reversal.
5. Support and Resistance: Identify strong support and resistance areas. A bounce off these levels can signal a reversal.
6. Volume Analysis: Increased volume during a price reversal can confirm the strength of the move, indicating a potential trend change.
7. Trendline Breaks: A break of established trendlines can signal a reversal, especially when combined with other indicators.
These strategies can help day traders identify and capitalize on reversal opportunities in the forex market.
What Are the Best Reversal Strategies for Day Trading?
Top reversal strategies for day traders include the following:
1. **Candlestick Patterns**: Look for patterns like hammers, engulfing patterns, or dojis to signal reversals.
2. **Support and Resistance Levels**: Identify key support and resistance zones; price often reverses at these levels.
3. **Moving Average Crossovers**: Use short-term moving averages crossing above or below long-term averages to signal potential reversals.
4. **RSI Divergence**: Watch for divergence between price and the Relative Strength Index (RSI) to indicate potential reversals.
5. **Fibonacci Retracement**: Use Fibonacci levels to find potential reversal points during price corrections.
These strategies help day traders identify and act on potential market reversals effectively.
Learn more about: Understanding Day Trading Reversal Strategies
How can moving averages assist in identifying reversals?
Moving averages help identify reversals by smoothing out price data, allowing traders to spot trends and potential turning points. A crossover of a shorter moving average above a longer one can signal a bullish reversal, while the opposite indicates a bearish reversal. Additionally, observing price action near moving averages can reveal support or resistance levels, further confirming reversal signals. Using moving averages in conjunction with other indicators enhances the accuracy of reversal strategies for day traders.
What psychological factors influence reversal trading?
Psychological factors influencing reversal trading include fear of loss, overconfidence, and the tendency to follow the herd. Traders often struggle with loss aversion, causing them to hold losing positions too long. Overconfidence can lead to taking excessive risks, while herd mentality may result in chasing trends instead of sticking to a reversal strategy. Additionally, cognitive biases like confirmation bias can affect decision-making, causing traders to ignore contrary signals. Understanding these psychological influences is crucial for effective reversal trading strategies.
How do you manage risk when trading reversals?

To manage risk when trading reversals, use these strategies:
1. Set Stop-Loss Orders: Place them just beyond the reversal point to limit losses.
2. Position Sizing: Only risk a small percentage of your capital on each trade to mitigate potential losses.
3. Use Multiple Time Frames: Confirm reversal signals across different time frames for stronger validation.
4. Identify Key Support/Resistance Levels: Trade reversals near these levels for higher probability trades.
5. Monitor Market Conditions: Be aware of overall market trends; avoid counter-trend trades in strong trends.
6. Take Partial Profits: Lock in gains as the trade moves in your favor to reduce risk exposure.
7. Stay Disciplined: Stick to your trading plan and avoid emotional decisions.
Implementing these strategies can help you effectively manage risk while trading reversals.
What are the advantages of reversal trading for day traders?
Reversal trading offers several advantages for day traders:
1. High Profit Potential: Catching reversals can lead to significant gains when the price shifts direction sharply.
2. Clear Entry and Exit Points: Reversal patterns often provide distinct signals, making it easier to identify when to enter and exit trades.
3. Market Inefficiencies: Reversal trading capitalizes on overbought or oversold conditions, exploiting market psychology and inefficiencies.
4. Risk Management: Traders can set tight stop-loss orders, minimizing potential losses if the reversal doesn't happen.
5. Flexibility: Reversal strategies can be applied across various assets, including stocks, forex, and commodities, allowing for diverse trading opportunities.
6. Technical Indicators: Many reversal strategies use established indicators (like RSI or MACD), enhancing decision-making with objective data.
7. Short-Term Focus: Ideal for day traders, reversal trading aligns with quick market movements, enabling rapid profit-taking.
By leveraging these advantages, day traders can effectively enhance their trading strategies and capitalize on market fluctuations.
How do you backtest a reversal trading strategy?
To backtest a reversal trading strategy, follow these steps:
1. Define Your Strategy: Clearly entry and exit criteria, including indicators like RSI or MACD for spotting reversals.
2. Collect Historical Data: Obtain historical price data for the asset you want to test. Ensure it includes enough volatility for effective reversal signals.
3. Choose a Backtesting Platform: Select software like MetaTrader or TradingView, which allows you to input your strategy rules.
4. Input Your Strategy: Program the defined entry and exit conditions into the platform.
5. Run the Backtest: Execute the backtest over your chosen historical timeframe. Analyze how your strategy would have performed.
6. Evaluate Performance: Review metrics like win rate, average profit per trade, and maximum drawdown. Adjust your strategy based on results.
7. Refine and Retest: Make necessary adjustments and repeat the backtesting process to ensure consistency and reliability.
This approach helps validate the effectiveness of your reversal strategy before live trading.
What are the pitfalls of reversal trading to avoid?

The main pitfalls of reversal trading to avoid include:
1. Ignoring Market Context: Failing to consider overall market trends can lead to false signals.
2. Lack of Confirmation: Entering trades without confirming signals with volume or other indicators can result in losses.
3. Overtrading: Taking too many reversal trades can increase transaction costs and risk exposure.
4. Inadequate Risk Management: Not setting stop-loss orders can lead to significant losses if the trade goes against you.
5. Chasing Trades: Jumping into a reversal too late can result in missed opportunities or entering at unfavorable prices.
6. Emotional Trading: Allowing emotions to dictate trades can cloud judgment and lead to poor decisions.
Focus on discipline and thorough analysis to mitigate these pitfalls.
How can news events trigger market reversals?
News events can trigger market reversals by impacting investor sentiment and altering supply and demand dynamics. For day traders, key strategies include:
1. News Reaction: Monitor breaking news and economic reports that can shift market direction. Trade on immediate price movements following the news.
2. Volume Analysis: Look for spikes in trading volume that often accompany news releases, indicating strong market interest and potential reversals.
3. Technical Indicators: Use indicators like RSI or moving averages to identify overbought or oversold conditions triggered by news.
4. Chart Patterns: Recognize reversal patterns like head and shoulders or double tops/bottoms that may form after significant news.
5. Sentiment Analysis: Gauge market sentiment through social media and trading forums to predict potential reversals based on collective trader behavior.
Implementing these strategies effectively can help day traders capitalize on market reversals prompted by news events.
What timeframe is best for executing reversal trades?
The best timeframe for executing reversal trades in day trading is typically the 5-minute or 15-minute charts. These timeframes provide enough detail to spot potential reversals while allowing for quick reactions. Look for key reversal patterns, support and resistance levels, and volume spikes to confirm your trades.
How do expert day traders approach reversal strategies?
Expert day traders approach reversal strategies by identifying key price levels, such as support and resistance, where reversals are likely to occur. They often use technical indicators like RSI or MACD to spot overbought or oversold conditions.
Traders look for candlestick patterns, such as hammers or engulfing candles, to confirm potential reversals. They also pay attention to volume; a surge in volume can signal a strong reversal. Setting tight stop-loss orders helps manage risk effectively.
Ultimately, expert traders combine these tools with market news and trader sentiment to enhance their reversal strategy's success.
Conclusion about Top Reversal Strategies for Day Traders
In summary, mastering reversal strategies is crucial for day traders looking to enhance their trading effectiveness. By understanding how to identify reversal patterns, utilize indicators, and incorporate candlestick analysis, traders can make informed decisions. Additionally, leveraging support and resistance levels, volume insights, and psychological factors is essential for successful execution. As you explore these strategies, consider backtesting and managing risk to avoid common pitfalls. For comprehensive support and resources tailored to your trading needs, DayTradingBusiness is here to guide you on your journey.